 Daniela Vargova1*
 Zuzana Kolková2Jan Dargaj3Lukas Bris3Jan Luptak3Zuzana Dankova2Sona Franova1Jan Svihra3Pavol Slávik4Martina Sutovska1
- 1Department of Pharmacology, Jessenius Faculty of Medicine in Martin, Comenius University in Bratislava, Martin, Slovakia
- 2Biomedical Center Martin, Jessenius Faculty of Medicine in Martin, Comenius University in Bratislava, Martin, Slovakia
- 3Department of Urology, Jessenius Faculty of Medicine in Martin, Comenius University in Bratislava, and University Hospital Martin, Martin, Slovakia
- 4Department of Pathological Anatomy, Jessenius Faculty of Medicine in Martin, Comenius University in Bratislava, and University Hospital Martin, Martin, Slovakia
Introduction: Clear cell renal cell carcinoma (ccRCC) is mostly diagnosed incidentally and has relatively high recurrence rates. Alterations in VHL/HIF and mTOR pathways are commonly present in ccRCC. The present study attempted to identify potential diagnostic markers at the biochemical and molecular level.
Methods: In total, 54 subjects (36 patients with ccRCC and 18 cancer-free controls) were enrolled. ELISA was used to measure the levels of HIF-1α in the tumor and healthy kidney tissue. The association between five selected SNPs (rs779805, rs11549465, rs2057482, rs2295080 and rs701848) located in genes of pathologically relevant pathways (VHL/HIF and mTOR) and the risk of ccRCC in the Slovak cohort was studied using real-time PCR.
Results: Significant differences in HIF-1α tissue levels were observed between the tumor and healthy kidney tissue (p < 0.001). In the majority (69%) of cases, the levels of HIF-1α were higher in the kidney than in the tumor. Furthermore, the concentration of HIF-1α in the tumor showed a significant positive correlation with CCL3 and IL-1β (p (R2) 0.007 (0.47); p (R2) 0.011 (0.38). No relationship between intratumoral levels of HIF-1α and clinical tumor characteristics was observed. Rs11549465, rs2057482 in the HIF1A gene did not correlate with the expression of HIF-1α either in the tumor or in the normal kidney. None of the selected SNPs has influenced the susceptibility to ccRCC.
Conclusion: More research is neccesary to elucidate the role of HIF-1α in the pathogenesis of ccRCC and the association between selected SNPs and susceptibility to this cancer.
Introduction
Renal cell carcinoma (RCC) is the most common type of primary kidney cancer with a clear cell variant (ccRCC) representing the majority of cases (70%–90%) [1]. The highest incidences of this cancer were recorded in North America and the Czech Republic [2]. RCC is mostly (60%) diagnosed incidentally and around 30% of patients have metastatic disease at the time of the diagnosis [3,4]. Five-year cancer specific survival (CSS) rates for patients with high grade (grades 3 and 4) tumors is significantly worse than for patients with low grade (grades 1 and 2) masses [5]. Furthermore, despite conventional therapy, a relatively high number of patients (20%–40%) experience recurrence [6]. Biological markers that would enable earlier diagnosis are therefore indispensable.
Various molecular mechanisms are involved in the pathogenesis of ccRCC. The most common alterations in this cancer are observed in the VHL/HIF pathway. Approximately 50%–60% of patients with sporadic ccRCC have some abnormality in the VHL gene [7]. Loss of the function of tumor suppressor protein VHL (pVHL) leads to accumulation and constitutive activation of hypoxia inducible factor 1α (HIF-1α) in cancer cells [8]. This transcription factor is responsible for the metabolic switch that allows survival of cells in the hypoxic environment. It induces the expression of genes involved in the Warburg effect (e.g., pyruvate dehydrogenase kinase) and angiogenesis (VEGF, PDGF-BB) [9–11]. Increased levels of HIF-1α are usually associated with a worse prognosis [12,13]. Additionally, HIF-1α is believed to play an important role in tumor-associated inflammatory signaling [14].
The mammalian target of rapamycin (mTOR) is a protein kinase that regulates cell growth and proliferation. Inappropriate activation of mTOR has been reported in RCC and in a variety of other cancers as well [15–17]. Once activated, mTOR affects the translation of oncogenic and angiogenic proteins (including HIF-1α), thus supporting cancer progression [7,18]. Aberrant mTOR signaling can result from genetic alterations in various components of the pathway (e.g., mTOR complexes or its upstream regulators PI3K and PTEN) [18].
Several single nucleotide polymorphisms (SNPs) were previously identified in the genes of the VHL/HIF and mTOR pathways. Among them, rs779805, rs11549465, rs2057482, rs2295080 and rs701848 were proposed to be potentially functional and responsible for the increased risk of various malignancies, including RCC [19–30].
The current study attempted to fulfill several objectives: 1.) analyze differences between the expression of HIF-1α in tumor and healthy renal tissue from patients diagnosed with ccRCC, 2.) analyze changes of HIF-1α tissue amount with respect to tumor nuclear grade (G) and tumor-node-metastasis (TNM) stage, 3.) determine the relationship between HIF-1α and cytokines in tumor tissue, and 4.) investigate whether any of the selected SNPs (rs779805, rs11549465, rs2057482, rs2295080 and rs701848) may serve as a potential diagnostic marker of ccRCC in Slovak cohort, by determining their association with the susceptibility to this cancer.
Patients and methods
Patients
In total, 54 subjects of Slovakian nationality participated in this study: 36 patients (28 men of 62.4 ± 8.3 years and 8 women of 63.6 ± 8.9 years) and 18 cancer-free controls (12 men of 65.1 ± 9.8 years and 6 women of 67 ± 5.9 years) aged 63.0 ± 8.4 and 66.0 ± 7.2 years, respectively. Both study groups were age-matched, as it is proved by statistically nonsignificant age difference between the two groups [p (t) 0.152 (1.45)]. Six female and 15 male patients had tumors of low grade (LG; grades 1 and 2). The other 15 subjects (3 women and 12 men) had high grade (HG; grades 3 and 4) tumors. Seven women and 19 men had the organ-confined (OC; pT1 and 2), while the other 2 females and 8 males had locally advanced (LA; pT3 and 4) tumors. The clinicopathological characteristics of patients study group is summarized in Supplementary Table S1. The inclusion criterium for the patients was histologically verified ccRCC that meets the criteria for surgical treatment. Any individual suffering from chronic disease of the urogenital system or any systemic diseases such as autoimmune, rheumatologic, endocrinne or severe cardiovascular disease were excluded from the study by taking a thorough medical history. The stage of the cancer was determined by computed tomography according to the World Health Organization 2016 classification criteria [31]. Tumor grade was determined by histopathological examination according to the WHO/ISUP (International Society of Urological Pathology) classification system [31]. Control subjects were recruited from individuals who underwent medical examination for non-malignant urological disease. They were not related to patients and had no history of any oncological disease. Both the healthy subjects and the patients provided 6 mL of peripheral venous blood. The blood was collected into EDTA tubes, promptly transported to the lab, and centrifuged at 3,000 rpm for 10 min. The buffy coat was then separated and stored at −80°C until further analysis. Tissue specimens (tumor- T and macroscopically normal kidney tissue- N) were obtained from patients during tumor removal performed at the Department of Urology of the Jessenius Faculty of Medicine in Martin and University Hospital Martin, Slovakia. Both ccRCC and healthy renal samples were removed from the same kidney, placed in sterile polypropylene tubes, and stored at −80°C until further analysis.
DNA isolation and SNP genotyping
Genomic DNA was extracted from white blood cells using the DNeasy Blood & Tissue Kit (Qiagen). This simple and time-efficient procedure enables DNA isolation from fresh or frozen anticoagulated blood. First, blood samples were lysed with proteinase K in AL buffer (provided by the kit) during 10 min of incubation at 56°C. Ethanol (99.6%) was then added to the lysates and the mixture was loaded onto the DNeasy membrane in a mini spin column placed in a 2 mL collection tube and centrifugated at 8,000 rpm for 1 min. During this step, DNA bound to the DNeasy membrane, and excess fluid was removed. Subsequently, two additional centrifugation cycles were performed using AW1 and AW2 buffers (provided by the kit) to ensure the elimination of residual contaminants and increase the purity of the DNA. Finally, DNA was eluted in AE buffer (provided by the kit) and its concentration was evaluated using a NanoDropTM spectrophotometer (Thermo Scientific, USA) at 260 nm.
The extracted DNA was analyzed for individual genotypes using the TaqMan allelic discrimination method based on conventional real-time PCR. The genotyping reaction mixture consisted of genotyping TaqMan Master Mix, RNase-free water, and pre-designed Applied BiosystemsTM TaqMan® SNP genotyping assays. Genotypic detection was performed in the 7,500 Fast Real-Time PCR instrument (Applied BiosystemsTM, Thermofisher Scientific, USA). Characteristics of the selected SNPs are shown in Supplementary Table S2.
Assessment of HIF-1α protein
HIF1α tissue levels were measured in the healthy kidney and ccRCC from 26 patients with the use of sandwich ELISA (LS-F4224). Clinical characteristics of these patients and all the raw data are described in the Supplementary Table S3. Supernatants used for the ELISA reaction were prepared according to the kit protocol as follows: 100 mg of tissue was washed with 0.02 M PBS (7.0–7.2 pH) to remove excess blood tissue and minced on ice. The samples were then placed into a tube containing 500 µL of 0.02 M PBS and homogenized on ice at 4,000 rpm (Homogenizer Stuart SHM2/Euro, Bibby Scientific, UK). The homogenates were subsequently subjected to a 3 freeze/thaw cycle and centrifuged at 7,170 rpm for 5 min at 4°C. Finally, the supernatant was collected, aliquoted, and frozen at −80°C until further analysis.
Assessment of cytokine tissue levels
Cell cytokine tissue levels were determined using a commercially available kit Bio-PlexTM Human Cytokine Standard 27-Plex assay (Bio-Rad, Hercules, California, USA). This assay allowed us to detect 27 biologically relevant cell signaling molecules that are significantly involved in cancer biology: basic fibroblast growth factor (bFGF), CXCL11 (eotaxin), granulocyte macrophage colony stimulating factor (GM-CSF), granulocyte colony stimulating factor (G-CSF); interferon gamma (IFN-γ); interleukins 1β, 1Ra, 2, 4, 5, 6, 7, 8 (CXCL8), 9, 10, 12p70, 13, 15 and 17A; interferon gamma-induced protein 10 (IP-10 also known as CXCL10); monocyte chemoattractant protein 1 (MCP-1 also known as CCL2); macrophage inflammatory proteins 1 α and β (MIP-1α and MIP-1β also known as CCL3 and CCL4); platelet-derived growth factor-BB (PDGF-BB); RANTES (CCL5); tumor necrosis factor α (TNF-α), and vascular endothelial growth factor (VEGF). The biomarkers of interest were measured in each sample simultaneously during one reaction. This method combines two detection approaches: sandwich ELISA and flow cytometry. First, the target molecule reacts with the capture antibody coupled to magnetic beads, and then the unbound proteins are removed in series of washes. Next, biotinylated antibody is added, and a sandwich complex is formed. The streptavidin-phycoerythrin (SA-PE) conjugate is used to visualize the created complex. Identification and quantification of analytes are performed by two laser lights with different wavelengths (635 nm and 532) built in the Bio-Plex® 200 System reader. The final concentration of cytokines is proportional to the mean fluorescence intensity (MFI) and is expressed in pg/mL. To acquire standardized values, the tissue concentrations of HIF-1α and cytokines were divided by total tissue protein levels (mg/mL) measured by Bicinchoninic acid assay (BCA) kit (Thermofisher Scientific).
Statistical analysis
A two-sample paired t-test was used to estimate the difference between HIF-1α expression in tumor (HIF-1αTU) and normal kidney tissue (HIF-1αN). Since the data were not trivial, the logarithmically transformed ratios of HIF-1αTU and HIF-1αN (log-T/N) of the patient samples were subjected to exploratory data analysis (EDA) and each observation was assigned to one of the two groups (Group 1 and Group 2) according to a higher posterior probability. The logarithmic ratios in each group were normally distributed. Group 1 was further analyzed using parametric unpaired t-tests (with Welch correction if necessary). The relationship between HIF-1αTU and cytokines in tumor tissue was determined by a Pearson correlation coefficient. The final results were visualized using boxplots and scatter plots.
The null hypothesis of no association between SNP and ccRCC was tested by Fisher exacts test in general, dominant, recessive, and multiplicative models. Odds ratio (OR) with 95% confidence interval (95% CI) was computed for each model. Chi-square test was performed as well. The Hardy-Weinberg equilibrium test was tested in both patients and controls.
The data were explored and analyzed in R [1], ver. 4.0.5 and in GraphPad, ver. 8.0.1 software. The precision of the estimates was quantified by the 95% confidence limits. Dichotomization was performed using the cutoff p-value of 0.05.
Results
Genetic association study
We have performed a genetic association study (GAS) in five selected SNPs (rs779805 (VHL), rs2057482 (HIF1A), rs11549465 (HIF1A), rs2295080 (MTOR) and rs701848 (PTEN)) using various models (general, dominant, recessive, and multiplicative). Wild-type genotypes/alleles were used as reference. Genotype frequencies of all the SNPs were consistent with the Hardy-Weinberg equilibrium in both the patient and control group (at a level of significance 0.05). Interestingly, the distribution genotypes for rs2057482 and for rs11549465 in HIF1A were the same in all patients, but not in controls. We were unable to evaluate these two SNPs in a general or recessive model as the minor polymorphic genotype was present only in the control group. The results of GAS are summarized in Table 1. The raw data from this analysis are shown in Supplementary Tables S5, S6.
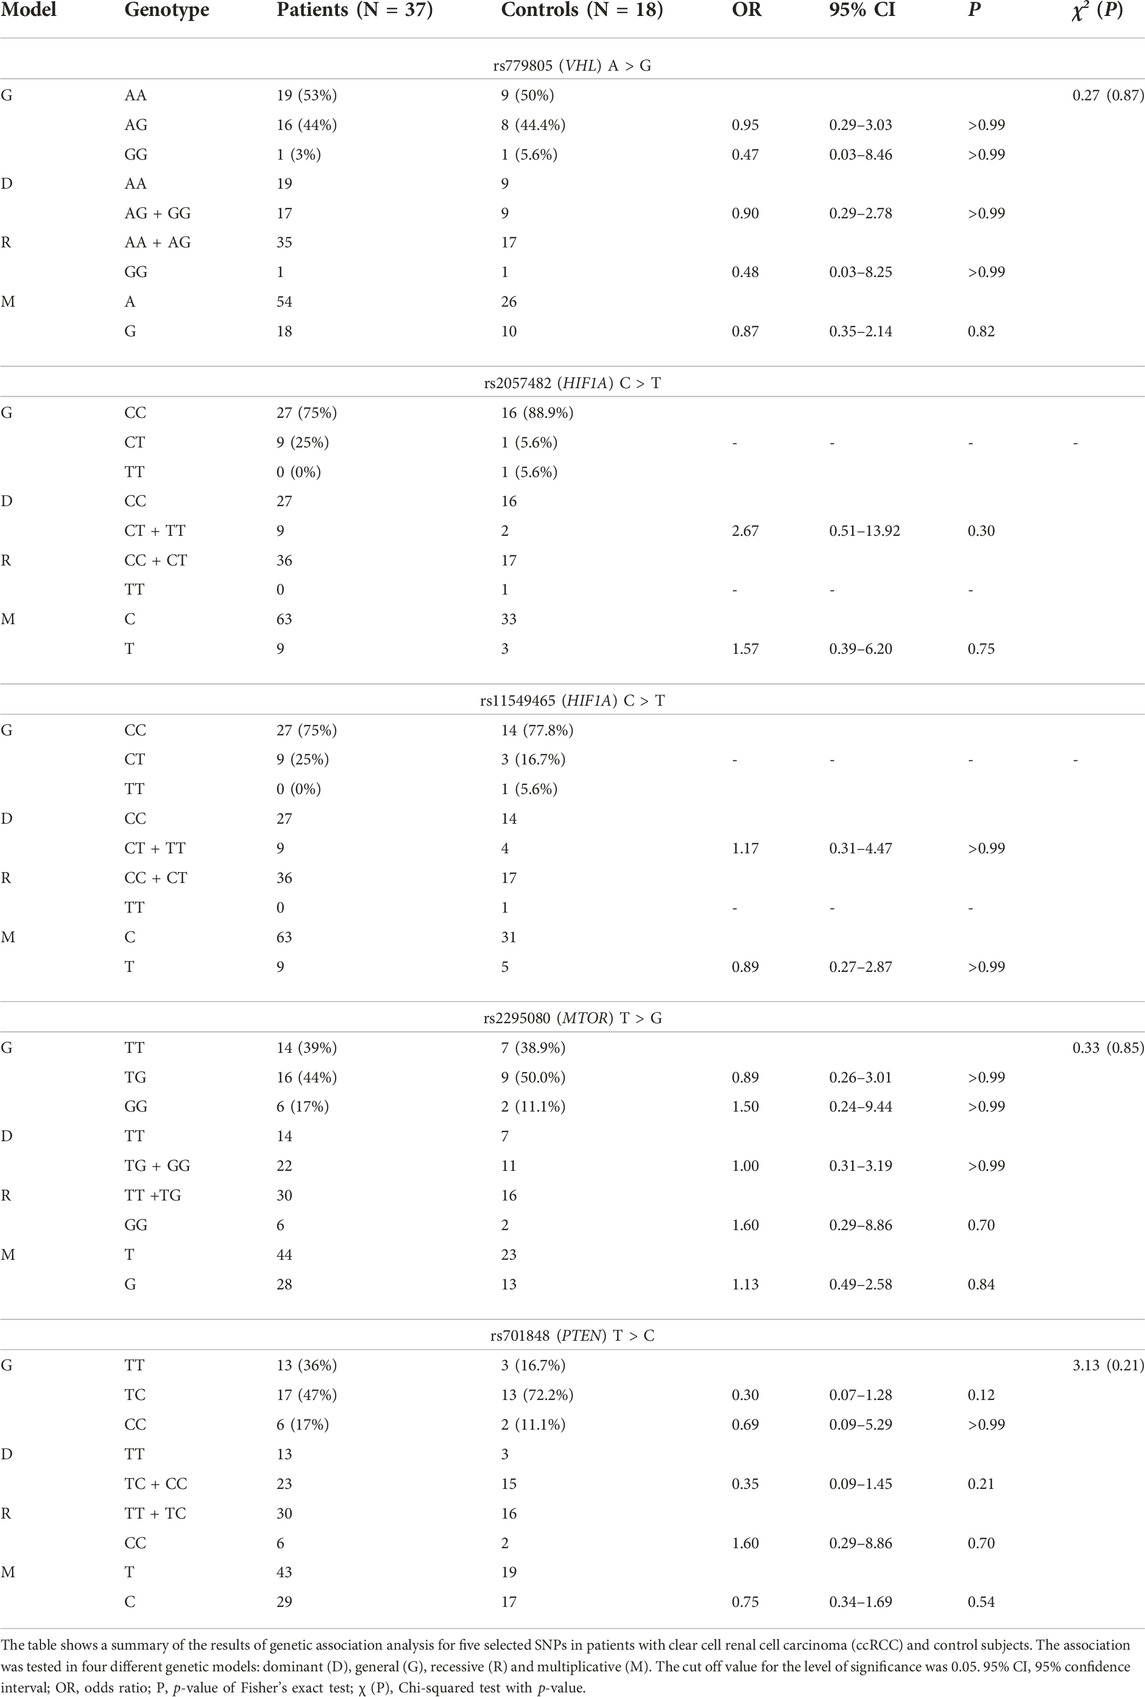
TABLE 1. The frequency of genotypes and alleles of selected gene polymorphisms in patients with ccRCC and controls.
In all cases p values have reached extremely high levels. Therefore, it is not possible to draw any explicit conclusions from these results at the moment and further investigations are warranted. However, according to the odds ratios (ORs) of general and dominant models, we can hypothesize that one or two recessive alleles at rs779805 may possibly have protective character with regard to the risk of ccRCC [GG vs. AA: OR (95% CI) = 0.47 (0.03–8.46), p > 0.99; AG vs. AA: OR (95% CI) = 0.95 (0.29–3.03), p > 0.99; GG/AG vs. AA: OR (95% CI) = 0.90 (0.29–2.78), p > 0.99]. The results of recessive and multiplicative models appear to be in line with this hypothesis [GG vs. AA/AG: OR (95% CI) = 0.48 (0.03–8.25), p > 0.99; G vs. A: OR (95% CI) = 0.87 (0.35–2.14), p = 0.82]. The general and recessive models for rs2295080 suggest that individuals with two minor alleles could have one and a half times higher odds ratio of developing ccRCC than subjects with one or two major alleles [GG vs. TT: OR (95% CI) = 1.50 (0.24–9.44), p > 0.99; GG vs. TG/TT: OR (95% CI) = 1.60 (0.29–8.86), p = 0.70]. In other words, based on the OR values in general model, we can hypothesize that one minor allele probably may not be sufficient to increase the susceptibility to ccRCC [TG vs. TT: OR (95% CI) = 0.89 (0.26–3.01), p > 0.99]. As for rs701848, the results of individual models are contradictory. While recessive model indicates that individuals with two minor alleles have higher odds ratio of developing ccRCC [CC vs. TC/TT: OR (95% CI) = 1.60 (0.29–8.86), p = 0.70], neither general [CC vs. TT: OR (95% CI) = 0.69 (0.09–5.29), p > 0.99] nor multiplicative model agree with this [C vs. T: OR (95% CI) = 0.75 (0.34–1.69), p = 0.54].
HIF-1α expression in ccRCC and kidney tissue
The results of our analysis have shown that two different groups of patients were present in our data set according to the means of log-HIF-1αTU and HIF-1αN. Group 1 consisted of 18 patients (69% of all cases) and Group 2 comprised 8 patients (31%). The samples were further classified according to clinical characteristics of the tumor as LG or HG and OC or LA. In Group 2 there were 87.5% patients with HG tumors, while in Group 1 the majority (72%) of subjects had LG tumors. In Group 2, 37.5% of the patients had LA disease, while in Group 1 it was 28%.
The means of log-HIF-1αTU and HIF-1αN values were compared between both groups using the unpaired t-test. The results have shown that the patients in Group 1 had higher levels of HIF-1α in normal tissue than in the tumor, while the individuals in Group 2 had exactly the opposite profile. The difference between the means of log-HIF-1αTU and log-HIF-1αN was statistically significant in both groups [p (t) < 0.0001 (5.82); p (t) = 0.0005 (5.28) respectively] (Table 2; Figure 1A). Furthermore, the tumor amount of HIF-1α in Group 1 was significantly lower compared to Group 2 [p (t) < 0.0001 (14.74)]. On the other hand, HIF-1α in normal tissue reached similar levels in both groups [p (t) = 0.64 (0.49)] (Table 2; Figure 1A). Since Group 1 was more numerous as to the samples, subsequent analyzes were performed only on this data set.
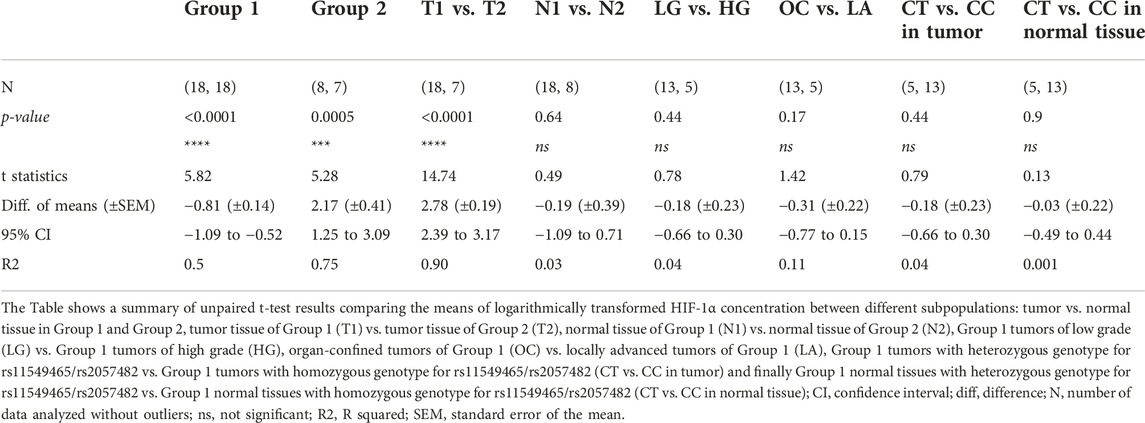
TABLE 2. Differences in HIF-1α concentration between two groups of patients and with regard to clinical and genetic parameters.
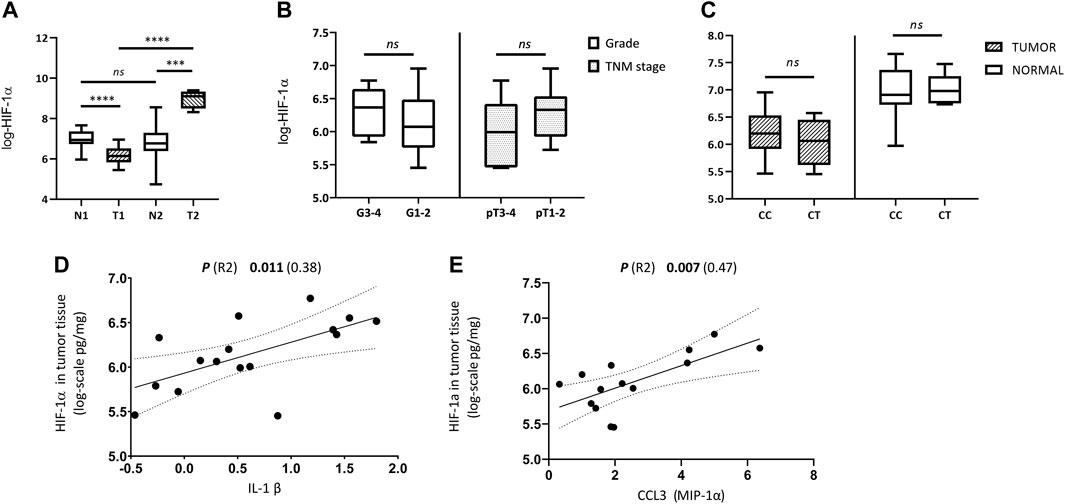
FIGURE 1. Comparison of HIF-1α tissue levels with regard to histological, clinical, genetic and immunological parameters. (A) Differences between HIF-1α expression in tumor and normal kidney tissue samples from patients with ccRCC in Group 1 (T1, N1) and Group 2 (T2, N2); (B) Differences in tumor tissue HIF-1α levels between high grade vs. low grade tumors (G3-4 vs. G1-2), and between locally advanced (LA) vs. organ-confined (OC) tumors (pT3 and 4 vs. pT1 and 2) of Group 1; (C) Difference in HIF-1α expression between tumor and normal kidney tissue of Group 1 according to genotypes (CC vs. CT) of rs2057482/rs11549465 in HIF1A gene; (D) Relationship between the amounts of HIF-1α and IL-1β in tumor tissue; (E) Relationship between the amounts of HIF-1α and CCL3 (MIP-1α) in tumor tissue. Concentration values of HIF-1α and cytokines used in the analyses were logarithmically transformed.
Expression of HIF-1α and clinical tumor characteristics
We have examined tumor tissue expression of HIF-1α in the Group 1 according to clinical tumor characteristics using unpaired t-test. No significant differences in HIF-1α tumor tissue levels were observed between LG and HG [p (t) = 0.44 (0.78)] nor between OC and LA [p (t) = 0.17 (1.42)] (Table 2; Figure 1B).
Effect of HIF1A polymorphisms on HIF-1α tumor and kidney expression
Next, we have analyzed whether the genetic status (genotype for rs2057482/rs11549465 in HIF1A) influences HIF-1α expression in either normal or tumor tissue. The mean value of log-HIF-1α in samples with the CC genotype was compared to log-HIF-1α in samples with the CT genotype. This was performed on tumor and normal tissue separately. No significant differences were detected in either case [p (t) = 0.44 (0.79); p (t) = 0.9 (0.13)] (Table 2; Figure 1C).
Association between HIF-1α expression and cytokine amounts in ccRCC
Finally, the levels of 27 biologically relevant cytokines (listed in Materials and methods) were measured in tumor tissue of Group 1 and correlated with HIF-1α tumor tissue levels. CCL3 (MIP-1α) and IL-1β have shown a significant positive correlation with HIF-1αTU [p (R-squared -R2) = 0.007 (0.47); p (R2) = 0.011 (0.38) respectively] (Table 3; Figures 1D, E). The raw data on cytokines used for this analysis are described in Supplementary Table S4 and were studied in more detail in our previous work [32].
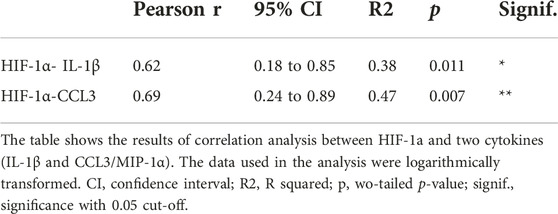
TABLE 3. Association between HIF-1a and cytokines.
Discussion
HIF-1 is a ubiquitously expressed protein consisting of α and β subunits. Under normoxia, HIF-1α is hydroxylated and undergoes proteasomal degradation. Oxygen deficiency typical for solid tumors or abnormalities in the VHL gene that are often present in ccRCC, disrupt this process and lead to the accumulation of α subunit in the cytoplasm which is then translocated to the nucleus and initiates the transcription of its target genes. Increased expression of crucial proteins for angiogenesis, glucose metabolism, tumor growth and progression (VEGF, PDGF, EGFR, IGF, GLUT-1, CXCR, CAIX and XII), can contribute markedly to the tumorigenesis of RCC [11, 12]. The expression of HIF-1α was shown to correlate with the clear cell phenotype of RCC [10, 33]. The percentage of ccRCC specimens positive for high levels of HIF-1α reported in previous studies ranged from 17% to 97% [10]. The results of the present study have shown that the majority (69%) of the patients with ccRCC had significantly higher levels of HIF-1α in kidney than in tumor tissue. A possible explanation for these low HIF-1α levels in our ccRCC samples may be a deletion of 14q or alternative mRNA splicing leading to production aberrant HIF-1α isoforms [11, 34]. Alternatively, this observation may be related to the clinicopathological tumor profile of the samples. Tumors in which HIF-1α was significantly lower than in healthy adjacent kidney tissue were mostly (72%) organ-confined and low grade. Thus, we can hypothesize that HIF-1α levels depend on the disease stage. This, indeed, was confirmed in the study by Chen et al. (2020). These authors observed a positive correlation between HIF1A overexpression and the more aggressive tumor phenotype of various human cancers [35]. However, another study reported significantly lower HIF-1α levels in locally aggressive ccRCC tumors than in localized tumors [36]. Hoefflin et al. (2020) also suggested that the loss of HIF1A, which is supposed to cause a decrease in HIF-1α protein levels, is more frequent in high-grade and high-stage ccRCC tumors [9]. When we compared the HIF-1α tissue levels between LG and HG tumors, and between OC and LA tumors from patients with a low HIF-1α log-T/N ratio (Group 1), no significant differences were observed in either case. This corresponds to the study by Klatte et al. (2007) [12]. Neither these authors did find any association between HIF-1α tumor expression and clinicopathological tumor characteristics. Clearly, more research is necessary to explain these discrepancies and elucidate the role of HIF-1α in ccRCC pathogenesis and its relationship with disease progression. However, its involvement in the pathological processes of this tumor is supported by the fact that the normal kidney tissue of both groups we studied contained significantly different amounts of HIF-1α than tumor tissue.
HIF-1α is not only a master regulator of hypoxia, but it also participates in the regulation of innate and adaptive immune responses [37–40]. Inflammation is one of the prominent features of the tumor microenvironment (TME) [41]. The presence of highly complex crosstalk between the inflammatory and hypoxia pathways is supported by the fact that many of the key signaling molecules (cytokines and chemokines) are induced by low oxygen levels [42–44]. For example, in the context of rheumatoid arthritis, HIF-1α was shown to directly interfere with the production of TNF-α, IL-1β, IL-6 and IL-8 [45]. The role of HIF factors in sterile inflammation was also demonstrated in epithelial and fibroblast cancer cell lines [46]. In the present study, we found a statistically significant positive correlation between HIF-1α and CCL3, and between HIF-1α and IL-1β. Both CCL3 and IL-1β are known to participate in cancer pathogenesis [47,48]. Although data on the association between HIF-1α and these cytokines in the available literature are scarce, similar observations but in different circumstances have been reported. For example, inhibition of HIF-1α in multiple myeloma cells was shown to decrease CCL3 secretion [49]. In contrast, IL-1β appears to be rather upstream than downstream component of HIF-1α pathway. Jung et al., 2003 suggested that this interleukin may indirectly (through NF-κB and COX-2) mediate HIF-1α upregulation [50]. Clearly, further investigation is needed to determine the direction, character and consequences of the complex interaction between HIF-1α and these cytokines.
Rs11549465 (Pro582Ser/C1772T) and rs2057482 (C191T) are supposed to be functional polymorphisms. The former is found in the exon 12 of HIF1A and codes for the oxygen-dependent degradation domain of HIF-1α protein. The C > T substitution in rs11549465 is supposed to give rise to a molecule resistant to degradation which leads to increased transcriptional activity of HIF1 complex [19]. Rs2057482 is located in 3′UTR of HIF1A. There are several reports that hypothesized that the minor T allele in this polymorphism may decrease the HIF1A expression by creating a new microRNA binding site [22,51–54]. However, according to our data, neither the tumor nor the normal kidney HIF-1α tissue levels did not appear to be influenced by any of these two polymorphisms in HIF1A.
Regarding the results of our GAS, we could not interpret the association between the HIF1A genotypes (rs1149465, rs2057482) and the risk of developing ccRCC since no recessive homozygotes were present in the group of patients. The results of other studies on this SNP are inconsistent. The possible importance of variant alleles in rs11549465 with respect to RCC susceptibility was proposed in European patients [21]. Additionally, the meta-analysis by Wu et al. (2019) performed on Asian population revealed that the polymorphism rs2057482 was associated with decreased overall cancer risk [55]. On the other hand, no significant differences between RCC cases and controls in genotype frequencies for rs11549465 and rs2057482 were observed in the Chinese population [22]. These discrepancies may be ascribed to different ethnicities.
Polymorphism rs779805 is located within the VHL gene promoter, which is abundant in CpG islands and prone to methylation [56]. Therefore, we can hypothesize that A > G substitution may increase the probability of silencing of the VHL gene and subsequently increase the risk of developing ccRCC. Our results do not appear to support this assumption. Although the level of significance for either general or recessive model was far above the cut-off p-value, OR indicate that individuals carrying either one or two risk alleles could probably have lower risk of developing ccRCC. No significant differences in rs779805 genotypes between RCC cases and controls were reported also by Bensouilah et al. (2020) and Qin et al. (2012) [22, 29]. On the other hand, several other studies demonstrated a positive association between G allele at rs779805 and RCC risk [26–28].
The importance of mTOR pathway-related genes in RCC pathogenesis is well established [57–59]. Dysregulation of this pathway is usually associated with an aggressive tumor behavior [57]. Transcriptional activity of the MTOR gene can be altered in different ways. For example, a minor G allele at rs2295080 in the promoter region of MTOR was shown to be significantly associated with decreased mRNA levels of MTOR [23]. Consequently, several studies reported that Asian people carrying TG and TG/GG genotypes have a lower risk of urinary cancers (including RCC) than carriers of two dominant alleles [23,24,30]. Contrary to these, are the results of the present study. The relationship between this polymorphism and ccRCC risk was not significant, but the general and recessive models indicate that two minor alleles in this polymorphism could potentially increase the risk of ccRCC development.
Another frequently mutated gene in solid tumors, including RCC, is PTEN [60,61]. Loss of activity of this tumor suppressor gene is responsible for upregulation of the PI3K-Akt-mTOR pathway and eventually leads to enhanced cell growth and proliferation [62]. Rs701848 polymorphism located in 3′UTR of the PTEN gene is supposed to alter the binding affinity of miRNAs to this region and thus interfere with the process of gene splicing and protein expression [63,64]. Therefore, it is possible that the variant allele in rs701848 may influence cancer susceptibility. Indeed, a meta-analysis performed in Asian individuals showed that the recessive homozygous genotype (CC) at rs701848 is significantly associated with an increased risk of overall and urinary system cancer [25]. Regarding RCC, only a marginal association of rs701848 with this malignancy was reported in subjects from China [23]. We did not confirm any significant relationship between the minor allele or minor genotype in rs7018484 and the risk of ccRCC but there is an indication that minor allele could possibly have a protective character. However, more research is undoubtedly necessary to verify this.
To conclude, our study has shown significant differences in HIF-1α tissue expression levels between ccRCC and healthy kidney, with most cases having a significantly higher amount of HIF-1α in normal than in tumor tissue. Tumor tissue levels of CCL3 (MIP-1α) and IL-1β displayed significant positive correlation with the amount of HIF-1α in the tumor. None of the selected SNPs (rs779805, rs11549465, rs2057482, rs2295080 and rs701848) were associated with increased susceptibility to ccRCC. One of the major limitations of the study is a small data set. Therefore, the presented results should be considered as preliminary only.
Data availability statement
All relevant data is contained within the article and supplementary materials. Any further inquiries can be directed to corresponding authors.
Ethics statement
The studies involving humans were approved by Committee of Jessenius Faculty of Medicine in Martin Comenius University in Bratislava (protocol code No. 53/2020, date of approval). The studies were conducted in accordance with the local legislation and institutional requirements. The participants provided their written informed consent to participate in this study.
Author contributions
Conceptualization, DV, ZK, MS, and ZD; methodology DV, ZK, JD, and LB; validation and formal analysis, DV and ZK; resources, JD, LB, and JL; data curation DV; writing original draft preparation, DV; writing–review and editing, MS, SF, and ZK; visualization, DV; supervision, MS; project administration, DV and ZK; funding acquisition, MS, SF, JS, and DV. All authors contributed to the article and approved the submitted version.
Funding
This publication has been produced with the support of grants VEGA 1/0428/21; VEGA 1/0072/23, APVV-19-0033, GUK 6/2021, GUK 132/2023 and the Operational Program Integrated Infrastructure for the project New Possibilities for the Management of Serious Diseases in Medical and Preventive Care with Regard to the Safety of Healthy Professionals, ITMS:313011AUA5, co-financed by the European Regional Development Fund.
Conflict of interest
The authors declare that the research was conducted in the absence of any commercial or financial relationships that could be construed as a potential conflict of interest.
Acknowledgments
We wish to thank assoc. prof. Zora Lasabova and the Department of molecular biology and genomics JFM CU and Katarína Jesenská for technical support.
Supplementary material
The Supplementary Material for this article can be found online at: https://www.por-journal.com/articles/10.3389/pore.2023.1611444/full#supplementary-material
References
1. Warren, AY, and Harrison, D. WHO/ISUP classification, grading and pathological staging of renal cell carcinoma: standards and controversies. World J Urol (2018) 36:1913–26. doi:10.1007/s00345-018-2447-8
2. Chow, W-H, Dong, LM, and Devesa, SS. Epidemiology and risk factors for kidney cancer. Nat Rev Urol (2010) 7:245–57. doi:10.1038/nrurol.2010.46
3. Vasudev, NS, Wilson, M, Stewart, GD, Adeyoju, A, Cartledge, J, Kimuli, M, et al. Challenges of early renal cancer detection: symptom patterns and incidental diagnosis rate in a multicentre prospective UK cohort of patients presenting with suspected renal cancer. BMJ Open (2020) 10:e035938. doi:10.1136/bmjopen-2019-035938
4. Makhov, P, Joshi, S, Ghatalia, P, Kutikov, A, Uzzo, RG, and Kolenko, VM. Resistance to systemic therapies in clear cell renal cell carcinoma: mechanisms and management strategies. Mol Cancer Ther (2018) 17:1355–64. doi:10.1158/1535-7163.MCT-17-1299
5. Kuthi, L, Jenei, A, Hajdu, A, Németh, I, Varga, Z, Bajory, Z, et al. Prognostic factors for renal cell carcinoma subtypes diagnosed according to the 2016 WHO renal tumor classification: a study involving 928 patients. Pathol Oncol Res (2017) 23:689–98. doi:10.1007/s12253-016-0179-x
6. Kim, SH, Park, B, Hwang, EC, Hong, S-H, Jeong, CW, Kwak, C, et al. Retrospective multicenter long-term follow-up analysis of prognostic risk factors for recurrence-free, metastasis-free, cancer-specific, and overall survival after curative nephrectomy in non-metastatic renal cell carcinoma. Front Oncol (2019) 9:859. doi:10.3389/fonc.2019.00859
7. Nabi, S, Kessler, ER, Bernard, B, Flaig, TW, and Lam, ET. Renal cell carcinoma: a review of biology and pathophysiology. F1000Res (2018) 7:307. doi:10.12688/f1000research.13179.1
8. Sato, Y, Yoshizato, T, Shiraishi, Y, Maekawa, S, Okuno, Y, Kamura, T, et al. Integrated molecular analysis of clear-cell renal cell carcinoma. Nat Genet (2013) 45:860–7. doi:10.1038/ng.2699
9. Hoefflin, R, Harlander, S, Schäfer, S, Metzger, P, Kuo, F, Schönenberger, D, et al. HIF-1α and HIF-2α differently regulate tumour development and inflammation of clear cell renal cell carcinoma in mice. Nat Commun (2020) 11:4111. doi:10.1038/s41467-020-17873-3
10. Gudas, LJ, Fu, L, Minton, DR, Mongan, NP, and Nanus, DM. The role of HIF1α in renal cell carcinoma tumorigenesis. J Mol Med (2014) 92:825–36. doi:10.1007/s00109-014-1180-z
11. Shen, C, and Kaelin, WG. The VHL/HIF axis in clear cell renal carcinoma. Semin Cancer Biol (2013) 23:18–25. doi:10.1016/j.semcancer.2012.06.001
12. Klatte, T, Seligson, DB, Riggs, SB, Leppert, JT, Berkman, MK, Kleid, MD, et al. Hypoxia-inducible factor 1 alpha in clear cell renal cell carcinoma. Clin Cancer Res (2007) 13:7388–93. doi:10.1158/1078-0432.CCR-07-0411
13. Fan, Y, Li, H, Ma, X, Gao, Y, Chen, L, Li, X, et al. Prognostic significance of hypoxia-inducible factor expression in renal cell carcinoma: a PRISMA-compliant systematic review and meta-analysis. Medicine (2015) 94:e1646. doi:10.1097/MD.0000000000001646
14. Balamurugan, K. HIF-1 at the crossroads of hypoxia, inflammation, and cancer. Int J Cancer (2016) 138:1058–66. doi:10.1002/ijc.29519
15. Alayev, A, and Holz, MK. mTOR signaling for biological control and cancer. J Cel Physiol (2013) 228:1658–64. doi:10.1002/jcp.24351
16. Cargnello, M, Tcherkezian, J, and Roux, PP. The expanding role of mTOR in cancer cell growth and proliferation. Mutagenesis (2015) 30:169–76. doi:10.1093/mutage/geu045
17. Pezzicoli, G, Filoni, E, Gernone, A, Cosmai, L, Rizzo, M, and Porta, C. Playing the devil’s advocate: should we give a second chance to mTOR inhibition in renal clear cell carcinoma? – ie strategies to revert resistance to mTOR inhibitors. Cancer Manag Res (2021) 13:7623–36. doi:10.2147/CMAR.S267220
18. Tian, T, Li, X, and Zhang, J. mTOR signaling in cancer and mtor inhibitors in solid tumor targeting therapy. Int J Mol Sci (2019) 20:755. doi:10.3390/ijms20030755
19. Enedina, J-C, Maria del Pilar, C-V, VictorAlberto, M-A, Patricia, M-B, Javier, F-T, Alberto, L-R, et al. Hypoxia inducible factor-1α gene rs11549465 might be protective factor for the development of type 1 diabetes mellitus. Endocrinol Diabetes Res (2018) 04. doi:10.4172/2470-7570.1000131
20. Tanimoto, K, Yoshiga, K, Eguchi, H, Kaneyasu, M, Ukon, K, Kumazaki, T, et al. Hypoxia-inducible factor-1alpha polymorphisms associated with enhanced transactivation capacity, implying clinical significance. Carcinogenesis (2003) 24:1779–83. doi:10.1093/carcin/bgg132
21. Ollerenshaw, M, Page, T, Hammonds, J, and Demaine, A. Polymorphisms in the hypoxia inducible factor-1alpha gene (HIF1A) are associated with the renal cell carcinoma phenotype. Cancer Genet Cytogenet (2004) 153:122–6. doi:10.1016/j.cancergencyto.2004.01.014
22. Qin, C, Cao, Q, Ju, X, Wang, M, Meng, X, Zhu, J, et al. The polymorphisms in the VHL and HIF1A genes are associated with the prognosis but not the development of renal cell carcinoma. Ann Oncol (2012) 23:981–9. doi:10.1093/annonc/mdr325
23. Cao, Q, Ju, X, Li, P, Meng, X, Shao, P, Cai, H, et al. A functional variant in the MTOR promoter modulates its expression and is associated with renal cell cancer risk. PLoS One (2012) 7:e50302. doi:10.1371/journal.pone.0050302
24. Qi, G-H, Wang, C-H, Zhang, H-G, Yu, J-G, Ding, F, Song, Z-C, et al. Comprehensive analysis of the effect of rs2295080 and rs2536 polymorphisms within the mTOR gene on cancer risk. Biosci Rep (2020) 40. doi:10.1042/BSR20191825
25. Zhang, Z, Chen, Q, Zhang, J, Wang, Y, Hu, X, Yin, S, et al. Associations of genetic polymorphisms in pTEN/AKT/mTOR signaling pathway genes with cancer risk: a meta-analysis in Asian population. Sci Rep (2017) 7:17844. doi:10.1038/s41598-017-17250-z
26. Lv, C, Bai, Z, Liu, Z, Luo, P, and Zhang, J. Renal cell carcinoma risk is associated with the interactions of APOE, VHL and MTHFR gene polymorphisms. Int J Clin Exp Pathol (2015) 8:5781–6.
27. van de Pol, JAA, van den Brandt, PA, van Engeland, M, Godschalk, RWL, van Schooten, FJ, Hogervorst, JGF, et al. Germline polymorphisms in the Von Hippel-Lindau and Hypoxia-inducible factor 1-alpha genes, gene-environment and gene-gene interactions and renal cell cancer. Sci Rep (2020) 10:137. doi:10.1038/s41598-019-56980-0
28. Wang, W-C, Tsou, M-H, Chen, H-J, Hsu, W-F, and Lai, Y-C. Two single nucleotide polymorphisms in the von Hippel-Lindau tumor suppressor gene in Taiwanese with renal cell carcinoma. BMC Res Notes (2014) 7:638. doi:10.1186/1756-0500-7-638
29. Bensouilah, FZ, Chellat-Rezgoune, D, Garcia-Gonzalez, MA, Carrera, N, Abadi, N, Dahdouh, A, et al. Association of single nucleotide polymorphisms with renal cell carcinoma in Algerian population. Afr J Urol (2020) 26:48. doi:10.1186/s12301-020-00055-4
30. Min, Z, Mi, Y, Lv, Z, Sun, Y, Tang, B, Wu, H, et al. Associations of genetic polymorphisms of mTOR rs2295080 T/G and rs1883965 G/A with susceptibility of urinary system cancers. Dis Markers (2022) 2022:1720851–16. doi:10.1155/2022/1720851
31. Moch, H, Cubilla, AL, Humphrey, PA, Reuter, VE, and Ulbright, TM. The 2016 WHO classification of tumours of the urinary system and male genital organs—Part A: renal, penile, and testicular tumours. Eur Urol (2016) 70:93–105. doi:10.1016/j.eururo.2016.02.029
32. Vargová, D, Dargaj, J, Fraňová, S, Dohál, M, Ľupták, J, Švihra, J, et al. Immunobiochemical profile of clear cell renal cell carcinoma (ccRCC): a preliminary study. Gen Biophys Physiol (2023) 42:387–401. doi:10.4149/gpb_2023015
33. Medina Villaamil, V, Aparicio Gallego, G, Santamarina Caínzos, I, Valladares-Ayerbes, M, and Antón Aparicio, LM. Searching for Hif1-α interacting proteins in renal cell carcinoma. Clin Translational Oncol (2012) 14:698–708. doi:10.1007/s12094-012-0857-4
34. Monzon, FA, Alvarez, K, Peterson, L, Truong, L, Amato, RJ, Hernandez-McClain, J, et al. Chromosome 14q loss defines a molecular subtype of clear-cell renal cell carcinoma associated with poor prognosis. Mod Pathol (2011) 24:1470–9. doi:10.1038/modpathol.2011.107
35. Chen, B, Li, L, Li, M, and Wang, X. HIF1A expression correlates with increased tumor immune and stromal signatures and aggressive phenotypes in human cancers. Cell Oncol (2020) 43:877–88. doi:10.1007/s13402-020-00534-4
36. Lidgren, A, Hedberg, Y, Grankvist, K, Rasmuson, T, Bergh, A, and Ljungberg, B. Hypoxia-inducible factor 1alpha expression in renal cell carcinoma analyzed by tissue microarray. Eur Urol (2006) 50:1272–7. doi:10.1016/j.eururo.2006.05.043
37. Kojima, H, Gu, H, Nomura, S, Caldwell, CC, Kobata, T, Carmeliet, P, et al. Abnormal B lymphocyte development and autoimmunity in hypoxia-inducible factor 1alpha -deficient chimeric mice. Proc Natl Acad Sci (2002) 99:2170–4. doi:10.1073/pnas.052706699
38. Lukashev, D, Caldwell, C, Ohta, A, Chen, P, and Sitkovsky, M. Differential regulation of two alternatively spliced isoforms of hypoxia-inducible factor-1 alpha in activated T lymphocytes. J Biol Chem (2001) 276:48754–63. doi:10.1074/jbc.M104782200
39. Cramer, T, Yamanishi, Y, Clausen, BE, Förster, I, Pawlinski, R, Mackman, N, et al. HIF-1alpha is essential for myeloid cell-mediated inflammation. Cell (2003) 112:645–57. doi:10.1016/S0092-8674(03)00154-5
40. Islam, SMT, Won, J, Khan, M, Mannie, MD, and Singh, I. Hypoxia-inducible factor-1 drives divergent immunomodulatory functions in the pathogenesis of autoimmune diseases. Immunology (2021) 164:31–42. doi:10.1111/imm.13335
41. Greten, FR, and Grivennikov, SI. Inflammation and cancer: triggers, mechanisms, and consequences. Immunity (2019) 51:27–41. doi:10.1016/j.immuni.2019.06.025
42. Malkov, MI, Lee, CT, and Taylor, CT. Regulation of the hypoxia-inducible factor (HIF) by pro-inflammatory cytokines. Cells (2021) 10:2340. doi:10.3390/cells10092340
43. Singh, N, Baby, D, Rajguru, J, Patil, P, Thakkannavar, S, and Pujari, V. Inflammation and cancer. Ann Afr Med (2019) 18:121–6. doi:10.4103/aam.aam_56_18
44. Balkwill, F, and Mantovani, A. Inflammation and cancer: back to Virchow? The Lancet (2001) 357:539–45. doi:10.1016/S0140-6736(00)04046-0
45. Hu, F, Liu, H, Xu, L, Li, Y, Liu, X, Shi, L, et al. Hypoxia-inducible factor-1α perpetuates synovial fibroblast interactions with T cells and B cells in rheumatoid arthritis. Eur J Immunol (2016) 46:742–51. doi:10.1002/eji.201545784
46. Rider, P, Kaplanov, I, Romzova, M, Braiman, L, Braiman, A, Voronov, E, et al. The transcription of the alarmin cytokine interleukin-1 alpha is controlled by hypoxia inducible factors 1 and 2 alpha in hypoxic cells. Front Immunol (2012) 3:290. doi:10.3389/fimmu.2012.00290
47. Bhavsar, I, Miller, CS, and Al-Sabbagh, M. Macrophage inflammatory protein-1 alpha (MIP-1 alpha)/CCL3: as a biomarker. Gen Methods Biomarker Res their Appl (2015) 2015:223–49. doi:10.1007/978-94-007-7696-8_27
48. Rébé, C, and Ghiringhelli, F. Interleukin-1β and cancer. Cancers (Basel) (2020) 12:1791. doi:10.3390/cancers12071791
49. Storti, P, Bolzoni, M, Donofrio, G, Airoldi, I, Guasco, D, Toscani, D, et al. Hypoxia-inducible factor (HIF)-1α suppression in myeloma cells blocks tumoral growth in vivo inhibiting angiogenesis and bone destruction. Leukemia (2013) 27:1697–706. doi:10.1038/leu.2013.24
50. Jung, Y-J, Isaacs, JS, Lee, S, Trepel, J, and Neckers, L. IL-1β mediated up-regulation of HIF-lα via an NFkB/COX-2 pathway identifies HIF-1 as a critical link between inflammation and oncogenesis. FASEB J (2003) 17:1–22. doi:10.1096/fj.03-0329fje
51. Wang, X, Ren, H, Zhao, T, Ma, W, Dong, J, Zhang, S, et al. Single nucleotide polymorphism in the microRNA-199a binding site of HIF1A gene is associated with pancreatic ductal adenocarcinoma risk and worse clinical outcomes. Oncotarget (2016) 7:13717–29. doi:10.18632/oncotarget.7263
52. Yamamoto, Y, Kiyohara, C, Ogata-Suetsugu, S, Hamada, N, and Nakanishi, Y. Association between genetic polymorphisms involved in the hypoxia-inducible factor pathway and lung cancer risk: a case-control study in Japan. Asia Pac J Clin Oncol (2017) 13:234–42. doi:10.1111/ajco.12640
53. Peckham-Gregory, EC, Thapa, DR, Martinson, J, Duggal, P, Penugonda, S, Bream, JH, et al. MicroRNA-related polymorphisms and non-Hodgkin lymphoma susceptibility in the Multicenter AIDS Cohort Study. Cancer Epidemiol (2016) 45:47–57. doi:10.1016/j.canep.2016.09.007
54. Almáši, M, Besse, L, Brožová, L, Jarkovský, J, Bezděková, R, Pour, L, et al. Selected genetic polymorphisms associated with hypoxia and multidrug resistance in monoclonal gammopathies patients. Klinicka Onkologie (2018) 31:213–29. doi:10.14735/amko2018213
55. Wu, L-F, Xu, G-P, Zhao, Q, Zhou, L-J, Wang, D, and Chen, W-X. The association between hypoxia inducible factor 1 subunit alpha gene rs2057482 polymorphism and cancer risk: a meta-analysis. BMC Cancer (2019) 19:1123. doi:10.1186/s12885-019-6329-2
56. Moore, LE, Nickerson, ML, Brennan, P, Toro, JR, Jaeger, E, Rinsky, J, et al. Von hippel-lindau (VHL) inactivation in sporadic clear cell renal cancer: associations with germline VHL polymorphisms and etiologic risk factors. Plos Genet (2011) 7:e1002312. doi:10.1371/journal.pgen.1002312
57. Miricescu, D, Balan, D, Tulin, A, Stiru, O, Vacaroiu, I, Mihai, D, et al. PI3K/AKT/mTOR signalling pathway involvement in renal cell carcinoma pathogenesis (Review). Exp Ther Med (2021) 21:540. doi:10.3892/etm.2021.9972
58. The Cancer Genome Atlas Research Network. Comprehensive molecular characterization of clear cell renal cell carcinoma. Nature (2013) 499:43–9. doi:10.1038/nature12222
59. Pantuck, AJ, Seligson, DB, Klatte, T, Yu, H, Leppert, JT, Moore, L, et al. Prognostic relevance of the mTOR pathway in renal cell carcinoma: implications for molecular patient selection for targeted therapy. Cancer (2007) 109:2257–67. doi:10.1002/cncr.22677
60. Fusco, N, Sajjadi, E, Venetis, K, Gaudioso, G, Lopez, G, Corti, C, et al. PTEN alterations and their role in cancer management: are we making headway on precision medicine? Genes (Basel) (2020) 11:719. doi:10.3390/genes11070719
61. Fan, C, Zhao, C, Wang, F, Li, S, and Wang, J. Significance of PTEN mutation in cellular process, prognosis, and drug selection in clear cell renal cell carcinoma. Front Oncol (2019) 9:357. doi:10.3389/fonc.2019.00357
62. Song, MS, Salmena, L, and Pandolfi, PP. The functions and regulation of the PTEN tumour suppressor. Nat Rev Mol Cel Biol (2012) 13:283–96. doi:10.1038/nrm3330
63. Lin, L, Zhang, Z, Zhang, W, Wang, L, and Wang, J. Roles of genetic variants in the PI3K/PTEN pathways in susceptibility to colorectal carcinoma and clinical outcomes treated with FOLFOX regimen. Int J Clin Exp Pathol (2015) 8:13314–22.
Keywords: HIF-1α, SNP, RCC, tumor, kidney
Citation: Vargova D, Kolková Z, Dargaj J, Bris L, Luptak J, Dankova Z, Franova S, Svihra J, Slávik P and Sutovska M (2024) Analysis of HIF-1α expression and genetic polymorphisms in human clear cell renal cell carcinoma. Pathol. Oncol. Res. 29:1611444. doi: 10.3389/pore.2023.1611444
Received: 08 August 2023; Accepted: 05 December 2023;
Published: 11 January 2024.
Edited by:
Anna Sebestyén, Semmelweis University, HungaryCopyright © 2024 Vargova, Kolková, Dargaj, Bris, Luptak, Dankova, Franova, Svihra, Slávik and Sutovska. This is an open-access article distributed under the terms of the Creative Commons Attribution License (CC BY). The use, distribution or reproduction in other forums is permitted, provided the original author(s) and the copyright owner(s) are credited and that the original publication in this journal is cited, in accordance with accepted academic practice. No use, distribution or reproduction is permitted which does not comply with these terms.
*Correspondence: Daniela Vargova, dmFyZ292YTIzOEB1bmliYS5zaw==