- Department of Gastrointestinal Surgery, The Third Affiliated Hospital, Sun Yat-sen University, Guangzhou, China
Objectives: We aimed to explore reasonable lymph node classification strategies for left-sided colon cancer (LCC) patients.
Methods: 48,425 LCC patients from 2010 to 2015 were identified in the US Surveillance, Epidemiology, and End Results database. We proposed an innovative revised nodal (rN) staging of the 8th American Joint Committee on Cancer (AJCC) Tumor/Node/Metastasis (TNM) classification based on the cut-off value of retrieved lymph nodes and survival analyses in patients with LCC. Log odds of positive lymph nodes (LODDS) stage is a numerical classification strategy obtained by a formula that incorporates the numbers of retrieved and positive lymph nodes. To develop the TrN or TLODDS classification, patients with similar survival rates were grouped by combining T and rN or LODDS stage. The TrN or TLODDS classification was further evaluated in a validation set of 12,436 LCC patients from 2016 to 2017 in the same database and a Chinese application set of 958 LCC patients.
Results: We developed novel TrN and TLODDS classifications for LCC patients that incorporated 7 stages with reference to the AJCC staging system. In comparison to the 8th AJCC TNM and TrN classifications, TLODDS classification demonstrated significantly better discrimination (area under the receiver operating characteristic curve, 0.650 vs. 0.656 vs. 0.661, p < 0.001), better model-fitting (Akaike information criteria, 309,287 vs. 308,767 vs. 308,467), and superior net benefits. The predictive performance of the TrN and TLODDS classifications was further verified in the validation and application sets.
Conclusion: Both the TrN and TLODDS classifications have better discriminatory ability, model-fitting, and net benefits than the existing TNM classification, and represent an alternative to the current TNM classification for LCC patients.
Introduction
Colorectal cancer (CRC) is the third most common cancer worldwide and the second most common cause of cancer-specific mortality (1). CRC continues to present challenges to patients and clinicians worldwide. Tumors originating in the distal third of the transverse colon, descending, sigmoid colon, and rectum are classified as left-sided colon cancer (LCC) tumors, whereas tumors originating in the caecum, ascending, and proximal two-thirds of the transverse colon are classified as right-sided colon cancer (RCC) tumors (2, 3). Recent in-depth research on CRC reported differences in clinical manifestations and patient prognosis between LCC and RCC (4–6). In the left-sided tumors, researchers observed chromosomal instability pathway-related mutations, such as KRAS, p53, APC, PIK3CA mutations, and demonstrate polypoid-like morphology (5–8). LCC and RCC have been identified as two different types of solid tumors. Evaluating LCC separately will have a positive impact on the application of individualized treatments to corresponding patients.
An accurate staging system is critical for clinical practice. Furthermore, the status of lymph nodes (N stage) is regarded as the most important predictor of survival (9). The American Joint Committee on Cancer (AJCC) Tumor/Node/Metastasis (TNM) classification is worldwide applied to assess the prognosis of patients with LCC. The American Society of Clinical Oncology and the National Comprehensive Cancer Network have issued guidelines for AJCC N staging of LCC requiring clinical physicians to evaluate at least 12 lymph nodes in clinical work (10). An increase in the number of retrieved lymph nodes (LNs) is known to be associated with a survival benefit for both node-negative and node-positive LCC patients (11). Nevertheless, insufficient lymph node sampling may lead to under-staging and subsequent misestimation of the prognosis (12). We aimed to investigate a more acceptable lymph node staging strategy for LCC, taking into account the quantity of retrieved LNs and metastatic status. We stratified the AJCC N staging based on the lymph node cut-off value and combined subgroups with similar survival rates to establish a revised nodal (rN) staging. Log odds of positive lymph nodes (LODDS) is another potential option as this could be applied to multiple types of cancers (13–15). LODDS has been proved to have a prognostic advantage for CRC (15).
The difference in prognosis between LCC and RCC indicates their different requirements for the staging system. So far, there are no reports exploring the prognostic value of the new staging system for LCC. In this study, we aimed to develop TrN and TLODDS classifications for LCC using a training set acquired from the US Surveillance, Epidemiology, and End Results (SEER) database. We compared the discrimination, model-fitting, and net benefits of the novel classifications to the 8th AJCC TNM classification to determine whether they could improve survival stratification. Finally, we investigated the predictive performance of new models in a validation set from the same database and an application set from a Chinese hospital.
Materials and methods
Data sources and screening criteria
48,425 cases of LCC from 2010 to 2015 were identified in the SEER database (National Cancer Institute, https://seer.cancer.gov/) to act as a training set, and 12,436 cases from 2016 to 2017 were considered as a validation set. We determined the codes from the International Classification of Diseases for Oncology for eligible patients: C185, C186, C187, C199 and C209 for LCC patients, and C180, C182, C183 and C184 for RCC patients (3). Data from the SEER database was exempted from informed consent and ethics committee review. We also incorporated an application set of LCC patients from The Third Affiliated Hospital of Sun Yat-sen University (SYSU). The latest follow-up was July 2021. The Institute Ethics Committee approved the study. The flow chart for patient selection is shown in Supplementary Figure S1.
Inclusion criteria: a positive follow-up; the primary tumor was located in the left-sided colon; being AJCC stage I–III.
Exclusion criteria: patients with incomplete clinicopathological information such as numbers of retrieved and positive lymph nodes, TN stage and primary site; patients who died during the first postoperative month.
Development of TrN and TLODDS staging systems
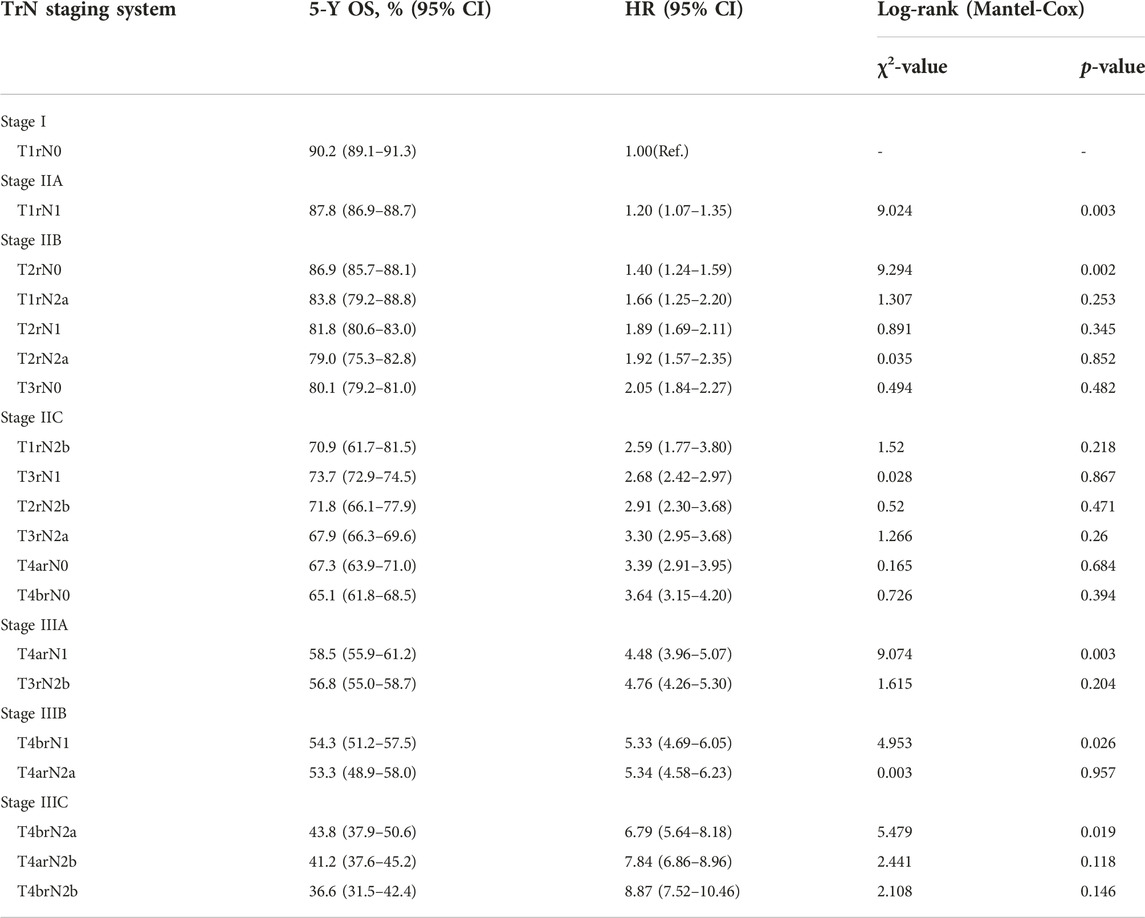
Lymph node involvement was classified according to the 8th AJCC pathological N (pN) classification (pN0: no metastasis; pN1a: 1 metastatic lymph node; pN1b: 2-3 metastatic LNs; pN1c: no metastatic lymph node, but there are tumor deposits (TD) in subserosal, mesenteric, pericolonic or perirectal tissue; pN2a: 4-6 metastatic LNs; pN2b: 7 and more metastatic LNs) (9). The optimal cut-off value of retrieved LNs in patients with LCC calculated by X-tile software in the training set was 14. Then, we developed a lymph node staging strategy called rN staging to homogenize the nodal classification of LCC cohorts comprising of both >14 (Adequate set) and ≤14 (Inadequate set) LNs. Six pN substages from pN0 to pN2b were obtained by using the 8th AJCC pN stage in Inadequate and Adequate sets, respectively. Table 1 shows the detailed overall survival (OS) rates of the 8th AJCC pN stage. By dividing it into its respective Inadequate set and Adequate set, we found that the 5-year OS rates of N0inadequate to N2ainadequate were closer to that of N1aadequate to N2badequate, rather than their corresponding N0adequate to N2aadequate. As displayed in Figure 2, there was no significant difference between Kaplan–Meier OS curves of patients under pN0inadequate and pN1aadequate (p = 0.73), pN1ainadequate and pN1cadequate (p = 0.59), pN1cinadequate and pN2badequate (p = 0.39). The p-value of survival curves of pN1binadequate and pN2aadequate was less than that of pN1binadequate and pN1cadequate. Table 2 showed that subgroups with similar survival rates were then aggregated to determine the rN stage. Next, we replaced the pN classification of the 8th AJCC pTNM staging system with our rN classification to form the pTrNM classification. Log-rank tests for OS were conducted between two neighboring substages and 19 χ2 values were generated (Table 3). The Cox proportional hazards model was used to estimate hazard ratio (HR) values for per substage (using the HR of T1rN0 as a reference), and all substages were sorted by HR values from the lowest (T1rN0) to the highest (T4brN2b). Five peak cutoff χ2 values (9.024, 9.294, 9.074, 4.953, 5.479) were identified in LCC patients, and merge substages between neighboring peak cutoff χ2 values. But there were far too many substages from substage T2rN0 to T4brN0. We chose substage T1rN2b to be stopped in the middle depending on the survival curve and HR value of each substage (Figure 3A; Table 3). We developed seven categories for the TrN classification (I, IIA, IIB, IIC, IIIA, IIIB, IIIC).
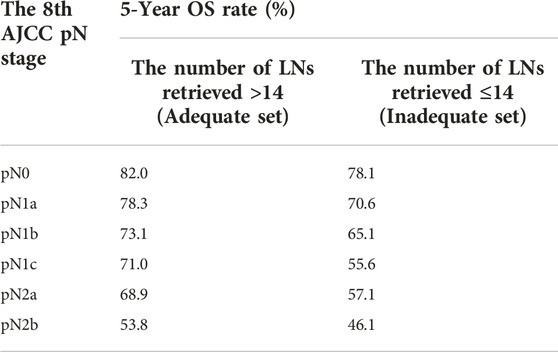
TABLE 1. 5-year overall survival (OS) rates of corresponding N0 to N2b of >14 LNs vs. ≤14 LNs cohorts.
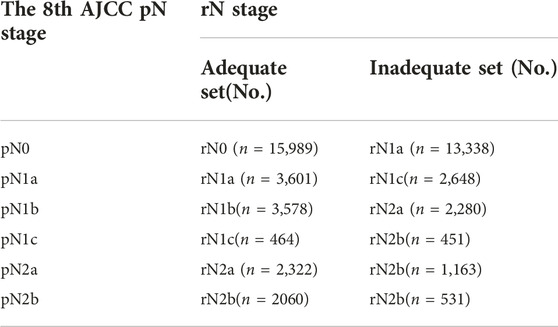
TABLE 2. The rN staging for LCC in the training set according to the 8th AJCC pN classification stratified into Adequate (>14 LNs) and Inadequate (≤14 LNs) set.
LODDS was estimated by:
Statistical analysis
We conducted a descriptive analysis of the study population. Continuous variables were expressed as median (interquartile range), while categorical variables were expressed as count and percentage. Their clinical characteristics were compared using Pearson’s χ2 test. The Kaplan–Meier method was used to calculate OS, and log-rank tests were used to compare survival differences between the groups. A cox proportional regression hazard model was used to identify risk factors significantly associated with OS. X-Tile software (https://medicine.yale.edu/lab/rimm/research/software.aspx) was used to identify the potential cut-off values for each LN group based on minimal probability (P) values (17). The predictive accuracy of the model was evaluated by the value of area under the receiver operating characteristic curve (AUC). A larger AUC value represented a more accurate model prediction. The linear trend χ2 test was used to measure the discriminatory ability and gradient monotonicity. The likelihood ratio χ2 test was used to assess the homogeneity (no significant differences in survival among patients with the same stage) within each stage. A higher linear trend chi-square score showed better discriminatory ability and monotonicity, while higher likelihood ratio chi-square scores meant better homogeneity. Akaike information criteria (AIC) and Bayesian information criterion (BIC) represented the model fitting level (18). A smaller AIC or BIC value indicated a more desirable model for prediction of OS outcomes. Clinical benefits were assessed by decision curve analyses (DCAs) (19, 20).
All analyses were performed with the R software (version 4.1.1; R Foundation for Statistical Computing, Vienna, Austria) and SPSS version 22.0 for Windows (IBM Corporation, Chicago, IL, USA), and a two-tailed p-value <0.05 was considered statistically significant.
Result
Relationships between the number of retrieved LNs and prognosis
Supplementary Table S1 shows the demographic and pathological characteristics of the eligible patients. The median number of retrieved LNs in LCC patients was larger than 12 (16 in the training set, 17 in the validation set, and 17 in the application set), implying that the number of LNs retrieved according to the guidelines was even less.
We used X-tile software to determine the best cut-off value for the number of LNs retrieved by LCC and RCC. According to descriptive statistics, the optimal minimum number of retrieved LNs of RCC is higher than that of LCC (18 vs. 14, as shown in Figure 1; Supplementary Figure S2). It is crucial to develop a lymph node staging system that distinguishes between LCC and RCC. Evaluation of LCC alone can more accurately evaluate the prognosis characteristics of LCC population. By comparing the number of LNs and cut-off value, LCC study population was divided into two categories, and the survival curves of LNs >14 (Adequate set) and LNs ≤14 (Inadequate set) were drawn, respectively. Two subgroups showed significant differences in survival prognosis (p < 0.0001, as shown in Figure 1B).
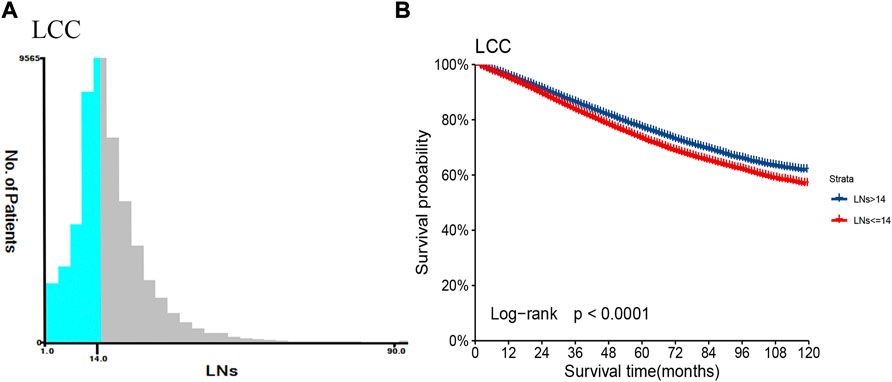
FIGURE 1. The number of retrieved LNs and prognosis difference between patients with LCC in the training set. (A) Based on the results of X-tile software, the best cut-off point of regional lymph node count in patients with LCC was determined. (B) The Kaplan-Meier survival curves of patients with LCC were depicted using the retrieved optimal thresholds of the two groups of retrieved LNs.
Development of rN classification and TrN staging system
We stratified 6 pN stages in the training set based on the LNs cutoff value and established rN stages by merging subgroups with similar survival rates. The initial six pN subgroups with LNs>14 (Adequate set) were labeled as rN0-rN2b. Subgroups with no significant difference in OS between LNs≤14 (Inadequate set) and LNs>14 (Adequate set) were combined (Figure 2; Table 2).
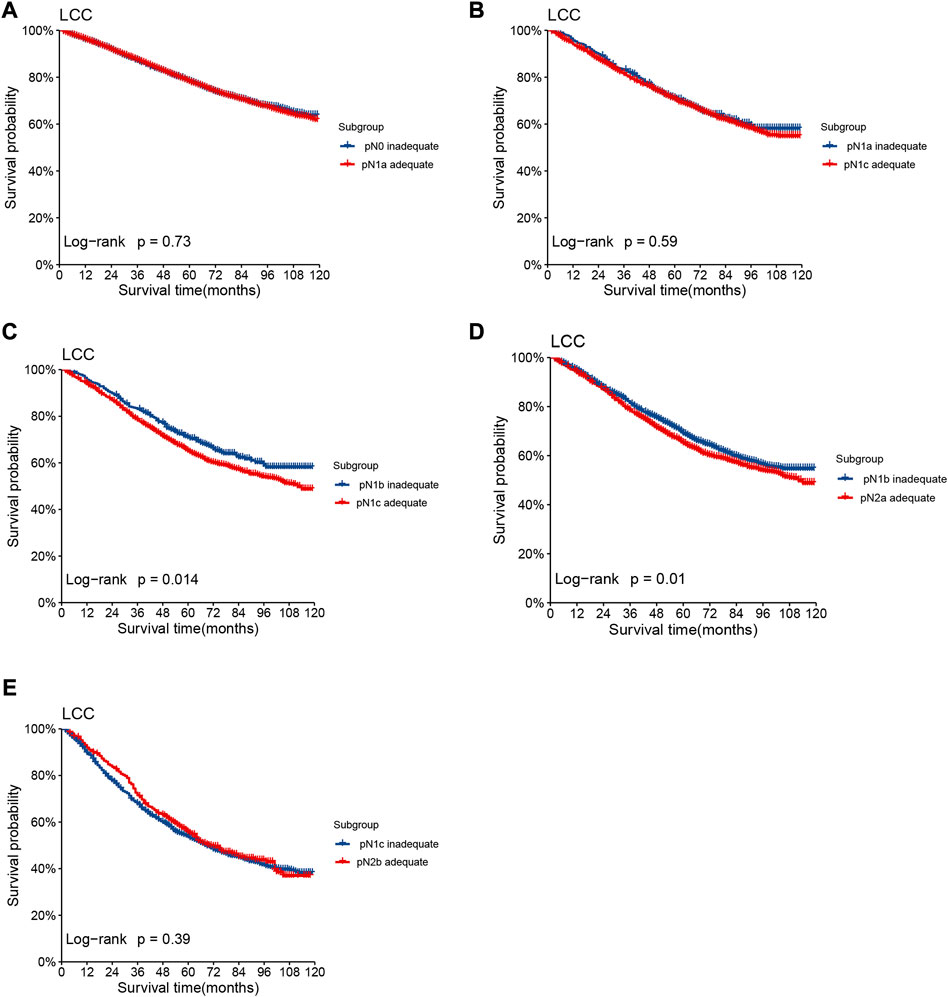
FIGURE 2. Kaplan–Meier OS curves of patients under different pN stages assigned to Inadequate set and Adequate set. Subgroup (A) pN0inadequate vs. pN1aadequate, (B) pN1ainadequate vs. pN1cadequate, (C) pN1binadequate vs. pN1cadequate, (D) pN1binadequate vs. pN2aadequate, (E) pN1cinadequate vs. pN2badequate of patients with LCC in the training set.
Referring to the 8th AJCC TNM stage, the three subgroups of pN1 have no effect on the overall TNM staging results, hence we consolidated rN1a-c into rN1 for subsequent analysis. Five peak cutoff χ2 values (9.024, 9.294, 9.074, 4.953, 5.479) were identified in LCC patients. Then we merged substages between neighboring peak cutoff χ2 values. A trouble was shown in Table 3. There were far too many substages from substage T2rN0 to T4brN0. We chose substage T1rN2b to be stopped in the middle, depending on the survival curve and HR value of each substage (Figure 3A; Table 3). Twenty substages were clustered into a novel TrN classification of seven clusters (Figure 3B).
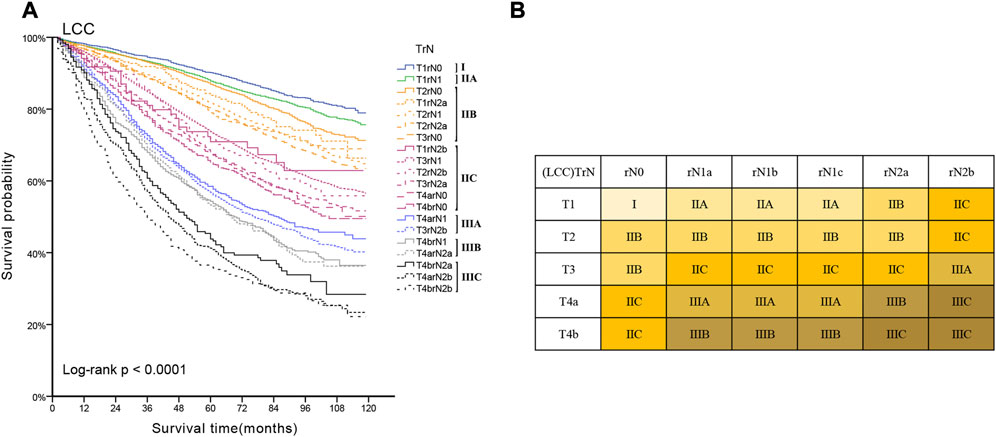
FIGURE 3. (A) Kaplan-Meier estimates for the novel classification of LCC characterized by T-stage and rN stage. (B) Details of the novel LCC TrN classification.
Development of LODDS classification and TLODDS staging system
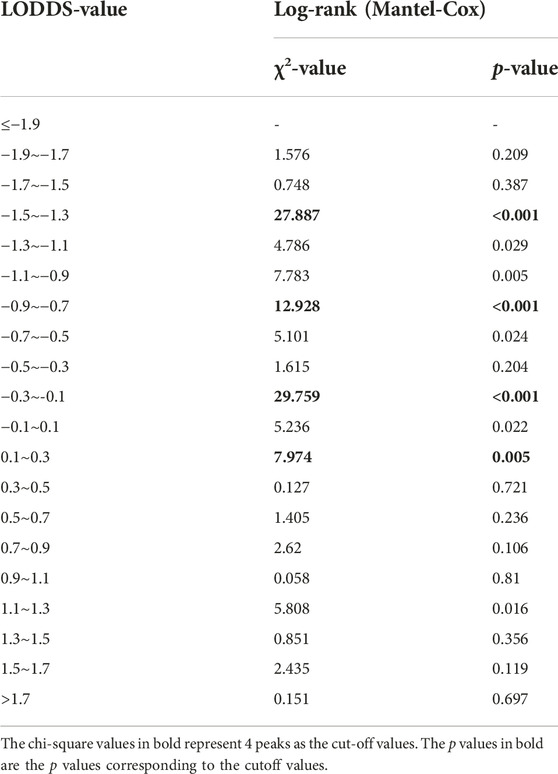
First, we calculated the LODDS value of each LCC patient in the training set, and then divided the study population into 20 subgroups according to the unit of 0.2. We used the log-rank (Mantel-Cox) test between adjacent subgroups to identify 19 cutoff χ2values. We chose four peak cutoff χ2 values (27.887, 12.928, 29.759 and 7.974) to distinguish the cut-off values of LODDS (−1.5, −0.9, −0.3 and 0.1) (Table 4). We created a LODDS stage consisting of five categories: (1) LODDS1≤−1.5; (2) −1.5< LODDS2≤−0.9; (3) −0.9< LODDS3≤−0.3; (4) −0.3< LODDS4≤0.1 and (5) LODDS5>0.1.
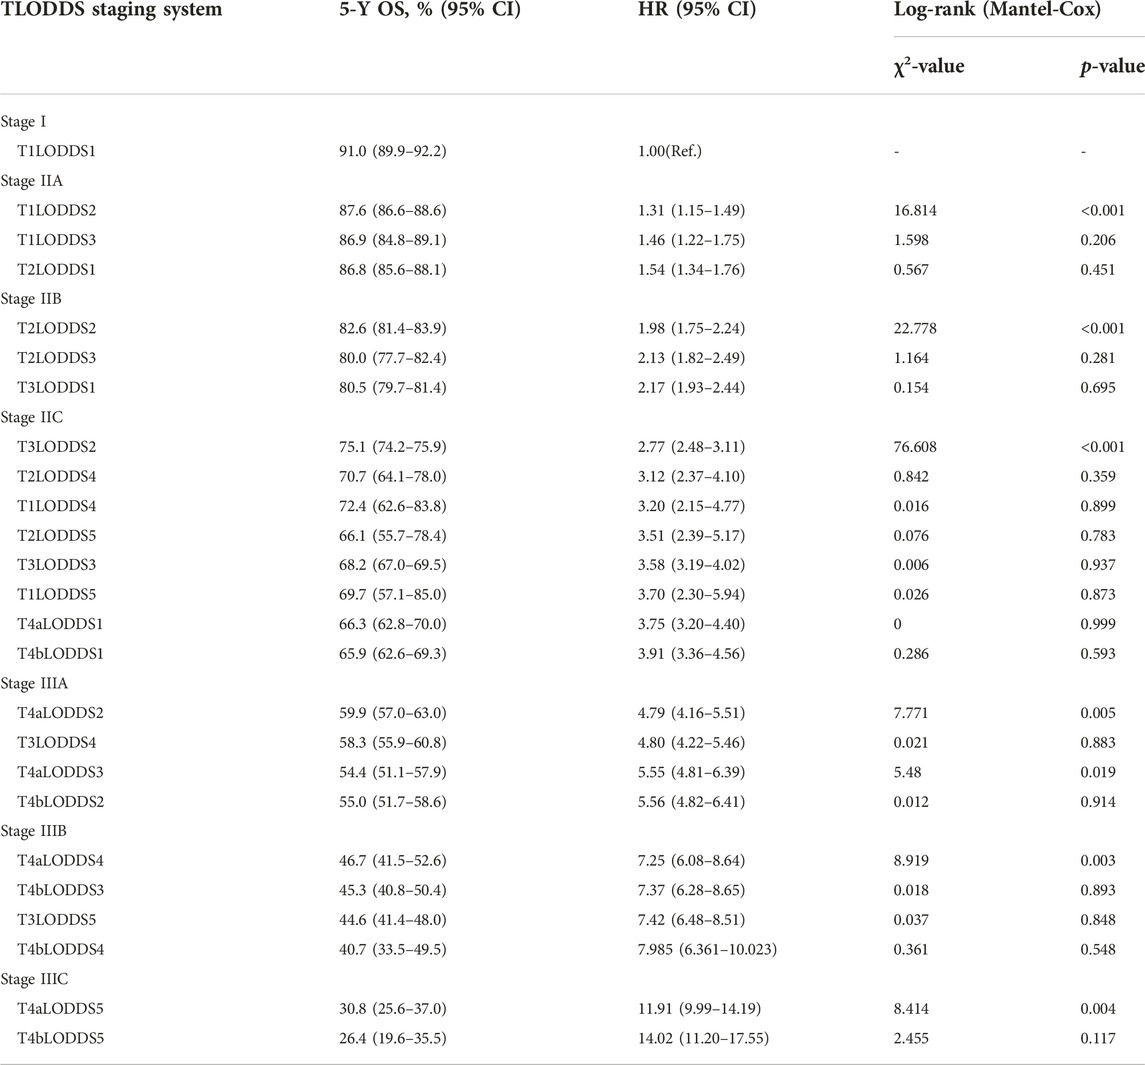
25 substages (T1-4bLODDS1-5) were created by merging the T and LODDS classifications. HR values were ranked from lowest to highest (using T1LODDS1 as a reference, HR = 1.00). We used the log-rank (Mantel-Cox) test between adjacent substages to identify 24 cutoff χ2 values. The six peak cutoff χ2 values (16.814, 22.778, 76.608, 7.771, 8.919, 8.414) whose corresponding p values were less than 0.05 between two neighboring substages were chosen. According to the six peak cutoff χ2 values, 25 substages were clustered into a novel TLODDS classification of seven categories (I, IIA, IIB, IIC, IIIA, IIIB, IIIC) (Table 5). Kaplan-Meier curves with log-rank tests and details of the novel TLODDS classification are shown in Figure 4.
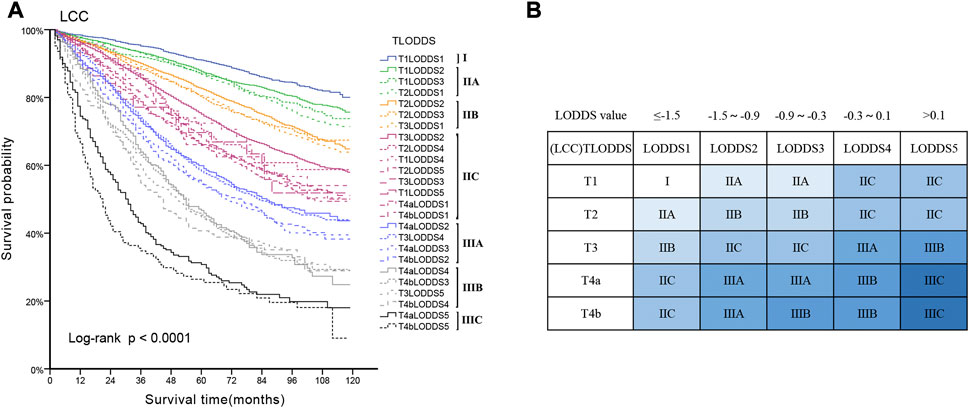
FIGURE 4. (A) Kaplan-Meier estimates for the novel classification of LCC characterized by T-stage and LODDS stage. (B) Details of the novel LCC TLODDS classification.
Comparison of the three staging systems
In the training set, the 8th AJCC TNM classification displayed an unreasonable predictive performance in that stage IIIA and IIIB had higher 5-year survival rates than stage IIA and IIB (Supplementary Table S2). However, the 5-year OS rates for LCC patients according to the TrN or TLODDS classification showed steadily decreasing trends as the stage increased (5-year OS, stages I to IIIC, 90.2%, 87.8%, 81.9%, 71.9%, 57.3%, 54.0% and 40.6% according to TrN classification; 91.0%, 87.3%, 81.1%, 72.0%, 57.3%, 44.8% and 29.4% according to TLODDS classification). Furthermore, HRs exhibited consistently increasing tendencies as the stage increased (HRs, stages I to IIIC, 1.0, 1.2, 1.9, 2.9, 4.7, 5.4 and 7.9 according to TrN classification; 1.0, 1.4, 2.1, 3.1, 5.1, 7.5 and 12.6 according to TLODDS classification). The TLODDS and TrN classifications also showed better prognostic discrimination (AUC, 0.661 vs. 0.656 vs. 0.650; Liner trend χ2 score, 3,104.5 vs. 2,851.6 vs. 1,504.4, p < 0.001), better model-fitting (AIC, 308,467 vs. 308,767 vs. 309,287), and superior net benefits than the TNM classification (Figure 5; Table 6).
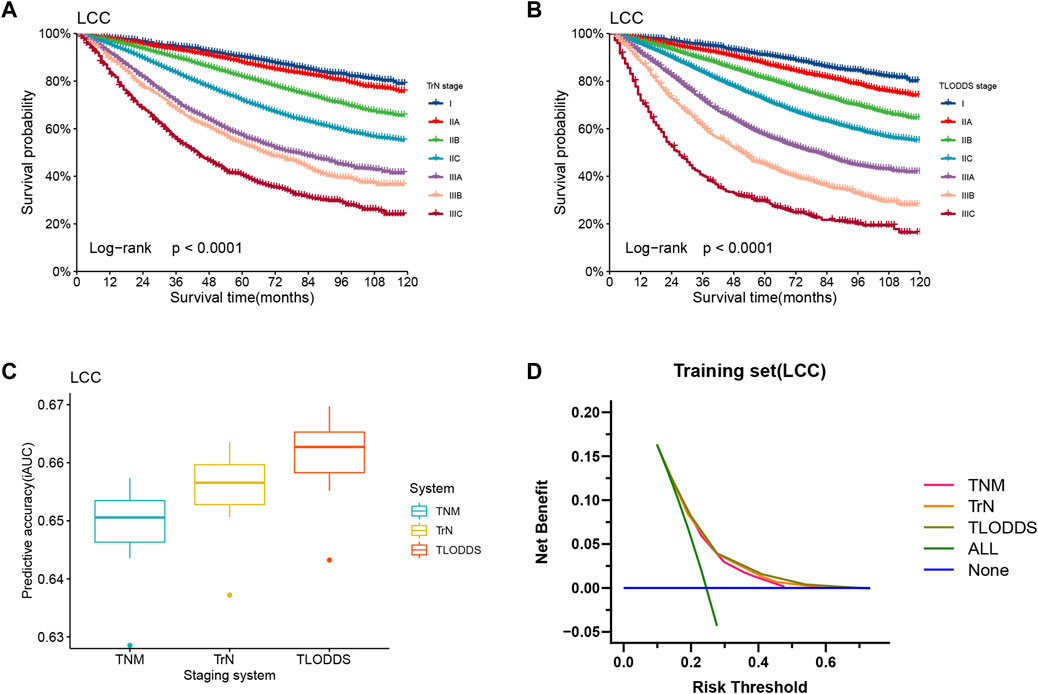
FIGURE 5. Model evaluation of three staging systems for patients with LCC in the training set. The Kaplan-Meier survival curves of patients with LCC in the training set were depicted according to the (A) TrN or (B) TLODDS staging system. (C) Performance of the TrN and TLODDS staging systems compared with the AJCC TNM staging system. (D) Decision curve analyses to compare the estimation of OS among the AJCC TNM, TrN and TLODDS classifications.
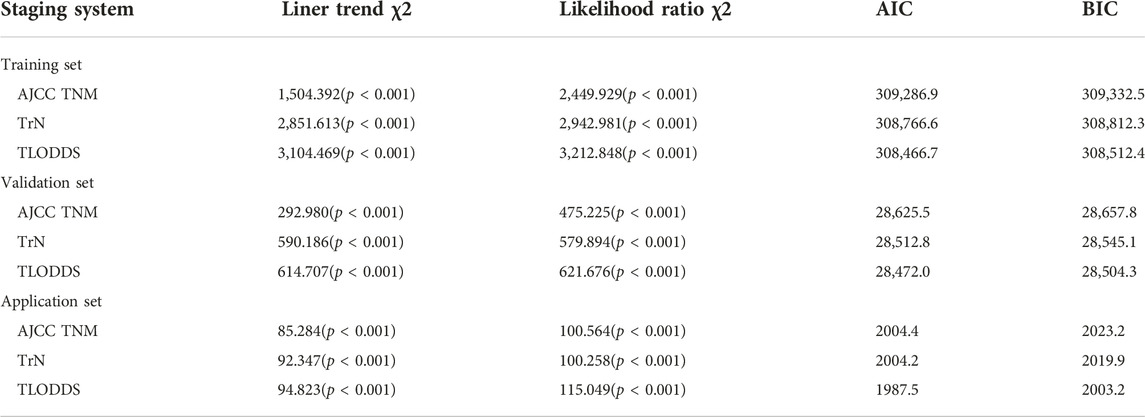
TABLE 6. Comparison of the performance of the 8th AJCC TNM, TrN and TLODDS staging systems in predicting prognosis of LCC.
The predictive performance of TrN and TLODDS classifications was validated in the validation or application set. As demonstrated in Figures 6, 7, both TrN and TLODDS classifications identify I-IIIC stages effectively in the validation or application set for patients with LCC, with significant differences in OS between neighboring stages. The TLODDS classification showed the best prognosis discrimination across the three staging systems (Figures 6C, 7C), as well as the best model fit and net benefit (Figures 6D, 7D; Table 6).
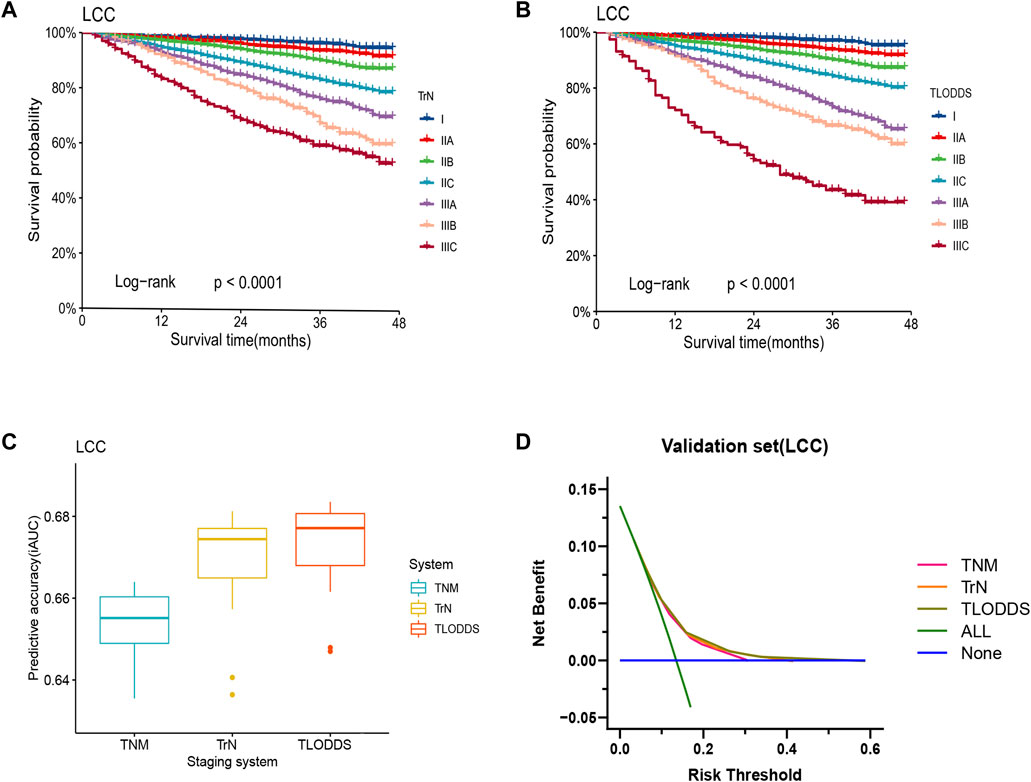
FIGURE 6. Model evaluation of three staging systems for patients with LCC in the validation set. The Kaplan-Meier survival curves of patients with LCC in the validation set were depicted according to the (A) TrN or (B) TLODDS staging system. (C) Performance of the TrN and TLODDS staging systems compared with the AJCC TNM staging system. (D) Decision curve analyses to compare the estimation of OS among the AJCC TNM, TrN and TLODDS classifications.
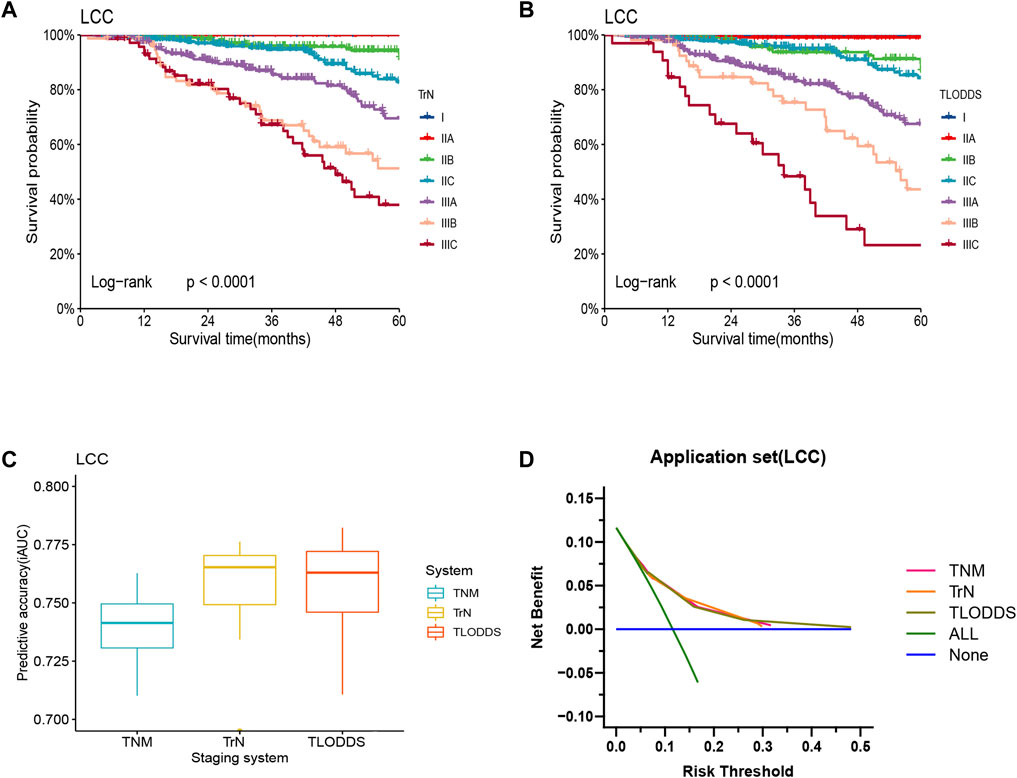
FIGURE 7. Model evaluation of three staging systems for patients with LCC in the application set. The Kaplan-Meier survival curves of patients with LCC in the application set were depicted according to the (A) TrN or (B) TLODDS staging system. (C) Performance of the TrN and TLODDS staging systems compared with the AJCC TNM staging system. (D) Decision curve analyses to compare the estimation of OS among the AJCC TNM, TrN and TLODDS classifications.
Discussion
Tumor staging is a key criterion for evaluating the severity of the cancer, formulating treatment strategies, predicting the recurrence risk and long-term survival of patients. Accurate staging allows cross-sectional comparisons of cohort data from different countries and centers. Currently, stage III of LCC patients even showed a trend of better prognosis than stage II patients according to the 8th AJCC TNM staging system used worldwide. It is crucial to develop new classifications to better stratify LCC survival. The primary flaw of the number-based AJCC pN classification is that the accuracy of the predicted prognosis was significantly influenced by the total number of retrieved LNs (11). The distinct requirements of LCC and RCC patients for the amount of retrieved LNs prompted us to investigate the lymph node staging of the two types of cancer (3). Scholars attempted to use the lymph node ratio (LNR, the ratio of the metastatic LNs and the total retrieved LNs) to predict patient outcomes (21). However, LNR cannot identify individuals without metastatic LNs, and its value is influenced by the overall number of LNs, hence it is not widely used. The recently proposed LODDS has demonstrated high prediction capacity in a variety of cancers (13–15). Andrea et al. and Persiani et al. proved that LODDS classification outperformed AJCC pN and LNR classifications (22, 23).
More researches focused on the prognostic factors of RCC patients while disregarding those of LCC patients. In this study, we developed a TLODDS staging utilizing AJCC T-stage combined with LODDS classification to stratify LCC patients into different survival groups. The TLODDS staging performed better in terms of prognosis discrimination, model fitting, and net benefit. However, the computation of LODDS is relatively complicated, which increases the complexity of clinical application. Furthermore, there are other factors that may affect prognosis, including CEA markers, adjuvant treatments, microsatellite instability, KRAS and BRAF mutation status, etc. (24–26) By integrating these factors, it is possible to further improve our new classification. To successfully apply the TLODDS classification in clinical practice, the development of corresponding clinical calculators and predictive models may be an effective approach. The AJCC pN classification solely takes into account the amount of positive LNs and cannot identify individuals who do not have metastatic LNs. But it is only grouped by counting, which has undoubted advantages in clinical practice. We developed rN classification with the aim of improving prognostic stratification without increasing computational complexity. The rN classification was obtained directly by simple calculations based on postoperative pathology reports. Compared with TLODDS staging, the TrN staging system has the advantages of simpler operation in clinical practice. This suggests that TrN may be a better alternative to the AJCC TNM or TLODDS classification. Both TrN and TLODDS staging systems performed well with regard to distinguishing survival differences among different sub-stages, reflecting their general applicability. These findings were confirmed in the validation set.
However, this study has some shortcomings. The SEER 22 enrollment data represents only 28% of the U.S. population, and these data were not randomly selected, making the analysis biased (27). Additionally, there was an unavoidable unknown bias owing to the retrospective experimental design. Validation in large, multi-center, prospective clinical trials is needed to obtain more reliable results.
Conclusion
In conclusion, the TrN and TLODDS staging systems can effectively distinguish the survival differences, and more accurately predict the 5-year OS rate of patients undergoing coloproctectomy with insufficient numbers of retrieved LNs compared with that of the TNM staging system.
Data availability statement
The original contributions presented in the study are included in the article/Supplementary Material, further inquiries can be directed to the corresponding authors.
Ethics statement
The studies involving human participants were reviewed and approved by Ethics Committee of the Third Affiliated Hospital of Sun Yat-sen University. Written informed consent from the participants or their legal guardian/next of kin was not required to participate in this study in accordance with the national legislation and the institutional requirements.
Author contributions
GJ and PL analysed the data and wrote the manuscript. YZ, XY, and JF were responsible for collecting data. ZZ had some advices for revisions. TC and HW designed the study and participated in data analysis and interpretation. All authors approved the paper.
Funding
This study is supported by the Medical Scientific Research Foundation of Guangdong Province, China (NO. A2021163) and the Clinical Medical Research 5010 Program of Sun Yat-sen University (2018023).
Conflict of interest
The authors declare that the research was conducted in the absence of any commercial or financial relationships that could be construed as a potential conflict of interest.
Supplementary material
The Supplementary Material for this article can be found online at: https://www.por-journal.com/articles/10.3389/pore.2023.1610874/full#supplementary-material
References
1. Keum, N, and Giovannucci, E. Global burden of colorectal cancer: Emerging trends, risk factors and prevention strategies. Nat Rev Gastroenterol Hepatol (2019) 16:713–32. doi:10.1038/s41575-019-0189-8
2. Gervaz, P, Bucher, P, and Morel, P. Two colons-two cancers: Paradigm shift and clinical implications. J Surg Oncol (2004) 88:261–6. doi:10.1002/jso.20156
3. Wu, W, Li, D, Ma, W, Zheng, S, Han, D, Xu, F, et al. Examining more lymph nodes may improve the prognosis of patients with right colon cancer: Determining the optimal minimum lymph node count. Cancer Control (2021) 28:10732748211064034. doi:10.1177/10732748211064034
4. Glebov, OK, Rodriguez, LM, Nakahara, K, Jenkins, J, Cliatt, J, Humbyrd, CJ, et al. Distinguishing right from left colon by the pattern of gene expression. Cancer Epidemiol Biomarkers Prev (2003) 12:755–62.
5. Baran, B, Mert, ON, Yerli, TN, Acar, E, Bekcioglu, O, and Baskin, Y. Difference between left-sided and right-sided colorectal cancer: A focused review of literature. Gastroenterol Res (2018) 11:264–73. doi:10.14740/gr1062w
6. Marzouk, O, and Schofield, J. Review of histopathological and molecular prognostic features in colorectal cancer. Cancers (Basel) (2011) 3:2767–810. doi:10.3390/cancers3022767
7. Gualco, G, Reissenweber, N, Cliche, I, and Bacchi, CE. Flat elevated lesions of the colon and rectum: A spectrum of neoplastic and nonneoplastic entities. Ann Diagn Pathol (2006) 10:333–8. doi:10.1016/j.anndiagpath.2006.03.003
8. Nawa, T, Kato, J, Kawamoto, H, Okada, H, Yamamoto, H, Kohno, H, et al. Differences between right- and left-sided colon cancer in patient characteristics, cancer morphology and histology. J Gastroenterol Hepatol (2008) 23:418–23. doi:10.1111/j.1440-1746.2007.04923.x
9. Amin, MB, Greene, FL, Edge, SB, Compton, CC, Gershenwald, JE, Brookland, RK, et al. The Eighth Edition AJCC Cancer Staging Manual: Continuing to build a bridge from a population-based to a more "personalized" approach to cancer staging. CA Cancer J Clin (2017) 67:93–9. doi:10.3322/caac.21388
10. Li, DG, Di Carlo, I, Scilletta, R, Scilletta, B, and Puleo, S. Colorectal cancer and lymph nodes: The obsession with the number 12. World J Gastroenterol (2014) 20:1951–60. doi:10.3748/wjg.v20.i8.1951
11. Le Voyer, TE, Sigurdson, ER, Hanlon, AL, Mayer, RJ, Macdonald, JS, Catalano, PJ, et al. Colon cancer survival is associated with increasing number of lymph nodes analyzed: A secondary survey of intergroup trial INT-0089. J Clin Oncol (2003) 21:2912–9. doi:10.1200/JCO.2003.05.062
12. Xie, D, Song, X, and Tong, L. Stage migration resulting from inadequate number of examined lymph nodes impacts prognosis in stage II colon cancer after radical surgery. Int J Colorectal Dis (2021) 36:959–69. doi:10.1007/s00384-020-03794-6
13. Deng, W, Xu, T, Wang, Y, Xu, Y, Yang, P, Gomez, D, et al. Log odds of positive lymph nodes may predict survival benefit in patients with node-positive non-small cell lung cancer. Lung Cancer (2018) 122:60–6. doi:10.1016/j.lungcan.2018.05.016
14. Xu, Z, Jing, J, and Ma, G. Development and validation of prognostic nomogram based on log odds of positive lymph nodes for patients with gastric signet ring cell carcinoma. Chin J Cancer Res (2020) 32:778–93. doi:10.21147/j.issn.1000-9604.2020.06.11
15. Pei, JP, Zhao, ZM, Sun, Z, Gu, WJ, Zhu, J, Zhu, J, et al. Development and validation of a novel classification scheme for combining pathological T stage and log odds of positive lymph nodes for colon cancer. Eur J Surg Oncol (2022) 48:228–36. doi:10.1016/j.ejso.2021.09.005
16. Wang, J, Hassett, JM, Dayton, MT, and Kulaylat, MN. The prognostic superiority of log odds of positive lymph nodes in stage III colon cancer. J Gastrointest Surg (2008) 12:1790–6. doi:10.1007/s11605-008-0651-3
17. Camp, RL, Dolled-Filhart, M, and Rimm, DL. X-Tile: A new bio-informatics tool for biomarker assessment and outcome-based cut-point optimization. Clin Cancer Res (2004) 10:7252–9. doi:10.1158/1078-0432.CCR-04-0713
18. Akaike, H. A new look at the statistical model identification. Ieee T Automat Contr (1974) 6:716–23. doi:10.1109/tac.1974.1100705
19. Fitzgerald, M, Saville, BR, and Lewis, RJ. Decision curve analysis. JAMA (2015) 313:409–10. doi:10.1001/jama.2015.37
20. Vickers, AJ, and Elkin, EB. Decision curve analysis: A novel method for evaluating prediction models. Med Decis Making (2006) 26:565–74. doi:10.1177/0272989X06295361
21. Greenberg, R, Itah, R, Ghinea, R, Sacham-Shmueli, E, Inbar, R, and Avital, S. Metastatic lymph node ratio (LNR) as a prognostic variable in colorectal cancer patients undergoing laparoscopic resection. Tech Coloproctol (2011) 15:273–9. doi:10.1007/s10151-011-0701-9
22. Scarinci, A, Di Cesare, T, Cavaniglia, D, Neri, T, Colletti, M, Cosenza, G, et al. The impact of log odds of positive lymph nodes (LODDS) in colon and rectal cancer patient stratification: A single-center analysis of 323 patients. Updates Surg (2018) 70:23–31. doi:10.1007/s13304-018-0519-3
23. Persiani, R, Cananzi, FC, Biondi, A, Paliani, G, Tufo, A, Ferrara, F, et al. Log odds of positive lymph nodes in colon cancer: A meaningful ratio-based lymph node classification system. World J Surg (2012) 36:667–74. doi:10.1007/s00268-011-1415-x
24. Zhang, C, Mei, Z, Pei, J, Abe, M, Zeng, X, Huang, Q, et al. A modified tumor-node-metastasis classification for primary operable colorectal cancer. JNCI Cancer Spectr (2021) 5:pkaa093. doi:10.1093/jncics/pkaa093
25. Imamura, Y, Lochhead, P, Yamauchi, M, Kuchiba, A, Qian, ZR, Liao, X, et al. Analyses of clinicopathological, molecular, and prognostic associations of KRAS codon 61 and codon 146 mutations in colorectal cancer: Cohort study and literature review. Mol Cancer (2014) 13:135. doi:10.1186/1476-4598-13-135
26. Kosumi, K, Hamada, T, Zhang, S, Liu, L, da Silva, A, Koh, H, et al. Prognostic association of PTGS2 (COX-2) over-expression according to BRAF mutation status in colorectal cancer: Results from two prospective cohorts and CALGB 89803 (Alliance) trial. Eur J Cancer (2019) 111:82–93. doi:10.1016/j.ejca.2019.01.022
Keywords: left-sided colon cancer, retrieved lymph nodes, log odds of positive lymph nodes, revised nodal stage, staging system
Citation: Jia G, Lei P, Zhang Y, Zheng Z, Fang J, Yang X, Wei H and Chen T (2023) New staging systems for left-sided colon cancer based on the number of retrieved and metastatic lymph nodes provide a more accurate prognosis. Pathol. Oncol. Res. 29:1610874. doi: 10.3389/pore.2023.1610874
Received: 09 October 2022; Accepted: 14 February 2023;
Published: 24 February 2023.
Edited by:
Anna Sebestyén, Semmelweis University, HungaryCopyright © 2023 Jia, Lei, Zhang, Zheng, Fang, Yang, Wei and Chen. This is an open-access article distributed under the terms of the Creative Commons Attribution License (CC BY). The use, distribution or reproduction in other forums is permitted, provided the original author(s) and the copyright owner(s) are credited and that the original publication in this journal is cited, in accordance with accepted academic practice. No use, distribution or reproduction is permitted which does not comply with these terms.
*Correspondence: Hongbo Wei, enNzeXdlaWhiQDE2My5jb20=; Tufeng Chen, Y2hlbnR1ZkBtYWlsLnN5c3UuZWR1LmNu
†These authors have contributed equally to this work
 Guiru Jia†
 Purun Lei
 Tufeng Chen